Level 2 Quotes – How to Read Market Depth Chart [Videos]
Category: Day Trading
Learn to day trade by viewing our free resource of over 100 articles and videos. The key is to figure out which system or strategy works best for you. Do not get caught in the vicious cycle of trying to master how someone else trades. Day trading requires you to put in the hard work to figure out what works.
Market depth charts are often a confusing and misunderstood part of trading. Besides just learning to read stock charts, level 2 quotes and order books are a lot like trying to read the matrix.
Numbers flash on the screen and then disappear quickly, especially during volatile trading moments. Also, it can be hard to tell what order are buy order, and what orders are sell orders. That being said, may seasoned traders use L2 data to predict support and resistance levels and liquidity zones.
In this post, we’ll discuss what level 2 trading is, and how to understand a stock depth chart to aid in your trading.
What is Level 2 Trading?
The Level 2 trading window provides data for pending orders in the market. [1]
Level 2 quotes display the size of the best bids and offers with their respective depths. Day traders use Level 2 stock data to gauge the direction of the stock market over the short-term. And, by short-term, we mean seconds to minutes.
How to Read a Level 2 Depth Chart
To read a level 2 depth chart, you need to understand the L2 data window structure. It is comprised of three key components: (1) bid/ask window, (2) size of orders, and (3) depth.
Level 2 Bid/Ask Prices
The bid/ask data contains the current bid and ask prices for the security across various exchanges. These could be from the NASDAQ, ARCA, BATS, or many more exchanges.
The L2 data is displayed in rows of what is known as the order flow. This order flow is also referred to as market depth and displays the best bids.
Here is an example of what this might look like in a professional day trading Level 2 window:
Level 2 market depth window
As you can see, the spread or distance between the bid and ask are close or near the top of the order book. You can also see which exchange is facilitating the orders.
Size of the Orders
The next key element is the size of the order which is displayed directly after the bid and the ask prices. This provides you with an idea of where traders are placing their orders,
which gives you some indication of their intent.
Order size in Level 2 order book
In the above image of a TSLA stock depth chart, the level 0 depth which is the first row, has 57595 buy orders at $700 and 100 sell orders at $700.65. That’s for the NSDQ exchange only. As you can see there are 63500 and 5965 shares sitting on the bid at the same price, $700.
This could mean one of two things, depending on the context. One, there are more traders looking to buy at lower prices, or two, there are more traders looking to sell on the bid. If you see the buy orders being gobbled up and the price is moving higher, this flow tells you that the shorts are in control and are able to push the stock lower.
In contrast, the orders are filled and the stock moves higher, it could be a key support level where buyers stepped in to move the price upward. This is benefit of watching level II market data.
Level 2 Depth Chart
The market depth chart is the visual representation of the orders and their respective size. The color of the graph in the market depth chart will match the color of the bid/ask data.
In TradingSim the depth is represented with histograms within the Level 2 window. This provides you a clear view of the order size without having to review the numbers of the Level 2 table.
For many, it’s just much easier to see the red and green charts to gauge which way the market is moving. However, color coding the depth chart allows you to see just how many exchanges have similar bids or offers sitting at a single price.
How to use level 2 market data
Notice the blocks we have circled. This gives you an idea of the depth of market in the level 2. This gives you an indication of how many orders may be stacking up at certain levels. This L2 data can then be used to make informed trading decisions based upon key levels.
Speed of Order Flow
At this point, we have discussed the structure of Level 2 data, but now it’s time to see it in action. In the below video we have taken a one-minute snapshot view of the order flow for the QQQ.
The QQQ is a popular security for day traders, so this will give you a good feel for the speed of the tape (a.k.a. Level 2).
Keep in mind that the speed of the order flow may increase during times of volatility, especially near the market open. The best way to study this is to have a replay service like TradingSim to slow things down in case you missed quick orders getting filled.
When to Read the Level 2 Tape
If you stare at Level 2 screens all day, you are going to get a headache. However, the best time to use L2 is at critical price levels. [2]
For example, if you are looking to buy a stock on a breakout, you can look at Level 2 to see the quality of the order flow to determine if a breakout has legs.
On that token, a key point to remember is that a stock can show a sign of strength for a brief moment in on a market depth chart, but ultimately fail.
This is where you have to really watch the order flow in the level 2 order book to begin to “feel” the market. This, my friend, takes time and is not something that you can just pick up after watching the market for a few days.
Breakout Example
Check out this video of a breakout as a stock approaches a key resistance level. The video is short, but you can see that the level 2 order flow at the resistance level picks up and the asking price continues to spike higher as sellers look for higher prices to execute trades.
Also, you will notice how the order flow accelerates at the breakout level and most importantly the price is able to hold this key level. Often, it is the price reaction coupled with the level 2 stock data that gives you the best picture.
So, what was the result of this positive level 2 trading action at the breakout point? You guessed it, higher prices.
Follow Through on Breakout
Do not look at this and assume all trades will work in this fashion. The key point from observing Level 2 is to gauge if the move is sustainable.
There is no exact method for making this observation. Anyone telling you that is oversimplifying the process of trading with L2 data. You will need to put in the hard work of observing market depth to assess signals from this off-chart indicator.
Where Level 2 Gets Tricky
Learning how to use Level 2 market data can prove challenging for the untrained eye. You see the orders flying, time and sales streaming, and green and red histogram bars sliding in and out.
It’s honestly a lot to absorb and make sense of.
The other thing is large institutions are now using AI to send buy and sell orders. [3] Not to mention, dark pools and other hidden orders can show up on charts when they don’t show up in the Level 2 data.
This can make it tricky to know if the orders in the depth are “real”. This practice of placing fake orders is spoofing and is illegal. Here is a link from the CFTC that highlights a case where a firm was found guilty of spoofing. These regulations have helped, but there still is a bit of grey area around how to read level 2 market data orders.
How to Combat the Robots
Ultimately, there is nothing you can do to stop these fake orders. The best thing you can do is to not solely rely on the tape for your trading strategy.
As with any strategy, you need to compliment your level 2 trading with chart reading skills. We have a lot of great articles on this site that teaches volume and price action trading.
In addition, check out this great piece from tradingshools.org which touches on this subject of spoofing.
Level II Order Flow with Thinly Traded Stocks
L2 is an awesome tool for stocks that trade with volume. However, stocks with light volume or wide spreads inform you very little about where a stock is likely to trend.
This is because the L2 window will have little to no order flow. So, it becomes extremely difficult to use L2 as an effective forecasting tool.
If you’re inclined to trade thinly traded stocks, keep in mind the issues associated with liquidity and potential liquidity traps. Often it is better look at higher time frame key volume levels rather than focus on the intraday level 2 data.
How Can TradingSim Help?
TradingSim offers a full Level 2 montage as part of it’s trading application. As we mentioned before, there is no better way to learn reading a depth chart by using level 2 data than by recording your screen or watching a replay.
With TradingSim, you don’t have to worry about recording. There is no need to store all that data on your hard drive. Not to mention, there are thousands of stocks in the market. We make it easy to replay every single one of them for up to 3 years worth of intraday data.
This will allow you to develop the muscle memory to master order flow to improve your trading results.
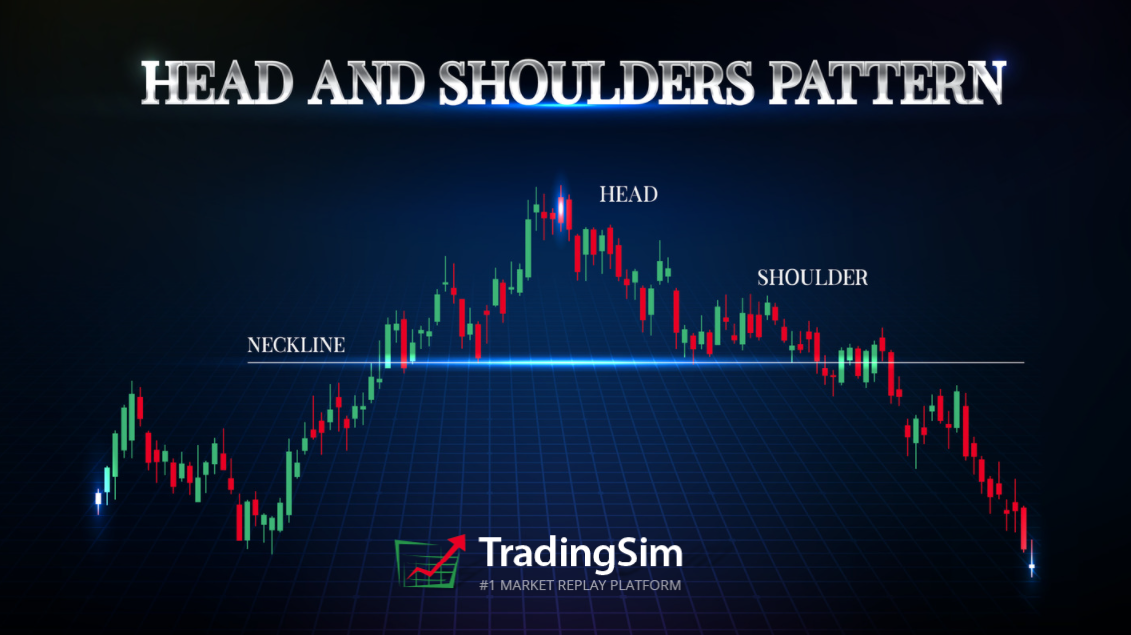
The Head and shoulders pattern is a reversal trading strategy, which can develop at the end of bullish or bearish trends. It is often referred to as an inverted head and shoulders pattern in downtrends, or simply the head and shoulders stock pattern in uptrends. In theory, they foretell the slowing momentum in either direction as the stock is unable to put in further highs or lows.
Traders like to trade head and shoulders patterns as the price targets are very predictable and the formation has an overall high success rate.
What do Head and Shoulders Chart Patterns Look Like?
The head and shoulders chart formation consists of three peaks, which develops after a strong bullish trend. The first and last peak are approximately the same height and are classified as the shoulders.
The second peak is the highest of the three and is classified as the head of the pattern.
Head and shoulders charts represent the transfer of power from the bulls to the bears in a topping pattern. In essence, it is a distribution pattern. Bulls who were buying the breakout (head), provided the liquidity for larger players to sell into, thus bringing the stock back down.
Please see the below illustration of a head and shoulders pattern top:
Head and Shoulders Top
What Do Inverse Head and Shoulders Chart Patterns Look Like?
Conversely, the inverted head and shoulders pattern is the head and shoulders bottom.
Instead of peaks, there are troughs. This reversal pattern develops after an extensive bearish trend and represents the transfer of control from bears to the bulls. Like the topping pattern, here bulls are using the breakdown as an opportunity to go long at lower prices. It could also give longer term bears the liquidity to cover their positions.
Below is an illustration of a head and shoulders bottom:
Head and Shoulders Bottom
This is an outline of the inverse head and shoulders pattern. As you see, it is the mirror image of the head and shoulders topping pattern.
Identifying the Neckline in a Head and Shoulders Pattern
Every technical chart pattern has a trigger line, which provides confirmation for entering or exiting a trade.
For the head and shoulders pattern, the trade signal is called the neckline.
When you think about it, this name makes sense, because the neckline is directly beneath the head and shoulders. Get it?
When we identify the pattern on the chart, the first thing we should do is to draw the neckline.
So, how do we draw the neckline?
The proper way to set up your neckline is to connect the two peaks or troughs (depending on if it’s a top or bottom). Here’s an example with $CEI:
$CEI head and shoulders pattern example
Please note the neckline isn’t always flat. If the peak or trough values are slightly different, then the neckline could have a slope.
We’ve tried to give you two examples of an early entry “Neckline A” and a later “Neckline B”. Both would work. It will depend on you and your style to outcome test head and shoulders chart patterns for the best entry.
What do Head and Shoulders Stock Patterns Foretell?
To determine the size of the formation, you should first set up the neckline as we just discussed.
Then, you take the mid-point of the neckline and draw a vertical line connecting the mid-point of the neckline to the top of the head. The distance between the neckline mid-point and the head is the distance we expect the stock to run after breaking through the neckline.
Please note, measuring price targets for head and shoulders and inverted head and shoulders will mirror each other. Again, the only difference is the formations are inverted.
How to Trade a Head and Shoulders Chart
When should you open a position?
When you identify the formation, you should start looking for the signal you need in order to enter the market. This signal is the moment when the price breaks through the neckline, for all intents and purposes.
When the neckline is broken, you should open a short position for head and shoulders tops and a long position for head and shoulders bottoms.
Granted, this is the old-school way to trade the pattern. Educators like Gil Morales teaches you to short into the pops on the right shoulder. He likes to find weaknesses into the overhead moving averages for good risk/reward.
This is a tricky question as traders’ opinions are pretty controversial regarding stop loss placement for the pattern.
Some traders claim that the stop loss should be loose and placed just above the head of the pattern.
A more conservative approach used by traders is to place the stop loss beyond the shoulder peak/trough.
We prefer placing the stop loss above the shoulder, as placing the stop above the head provides a 1:1 risk reward ratio. This isn’t very favorable odds.
When should you collect profits – Reverse Head and Shoulders Pattern Example 1
Again, the rule of thumb for this pattern is to determine the price target based on the depth of the pattern.
If this sounds confusing to you, have a look at the image below:
Price Target
This is a classic inverted head and shoulders scenario. This is the 30-minute chart of Apple. First, we have a bearish market followed by the creation of an inverted head and shoulders formation.
You can see the neckline – the brown line. Once the neckline is broken to the upside, we were able to set our price target based on the depth of the neckline to the trough of the head, which is represented with the black arrow.
After we establish our long position, we place our stop loss below the last shoulder as shown in the image.
After 24 hours, our minimum target is reached and we exit the position after the first bearish candle circled in green.
This inverted head and shoulders formation brings us a profit of $2.20 per share with the Apple equity.
While we exited this position near the target, you should not exit your position if the price continues to move in your favor.
Reverse Head and Shoulders Target Example 2
Having fun? Let’s go through another example.
Price Target
This is the 30-minute chart of Facebook.
After a strong downtrend, an reverse head and shoulders pattern develops. Again, we identify the neckline by drawing a brown line across the shoulders.
We open a long position with the first candle that closes above the brown neckline. Meanwhile, we establish our minimum target, which is illustrated with the black arrow.
After a few days, the price reaches our minimum target, but we stay with our long position until our bearish signal develops. For more information on bearish candlestick patterns as entry and exit signals, visit our guide to candlesticks.
A few hours later, a hanging man develops and we close our long position. From this long position, we were able to generate profits of ~ $4.00 per share.
When does the Head and Shoulders Pattern Fail
Although head and shoulders are considered one of the most reliable chart patterns for equity trading, like any other chart technique – it can fail.
Sometimes, we will receive our confirmation signal and the price does not reach our minimum target.
In other cases, the price will confirm the formation by breaking the neckline, and we will see absolutely no movement in our favor. These cases are not rare at all.
Pattern Failure
This is the 60-minute chart of Toronto-Dominion Bank. After a steady downtrend, an inverted head and shoulders formation develops.
We establish the neckline, price target, and stop loss, which are best practices for identifying the formation.
Unfortunately, after opening a long position, TD Bank begins to retreat below the neckline and ultimately trips our stop-loss order.
From this position, we accumulated a loss of ~52 cents ($0.52) per share. Although all the symptoms of an effective pattern are there, things didn’t work out.
This is why it is important to respect your stops!
Day Trading Head and Shoulders Tops
The first thing to consider when day trading this pattern is that it requires time. Unless you are on sub-minute charts or tick charts, you will likely need two days worth of bars or an early afternoon set up for the formation to fully develop.
Like any other trading setup, you will need more than just the chart pattern to be a success. Some of these items include proper money management and a firm understanding of risk on each trade.
Back to an intraday example, check out this head and shoulders chart of RPM.
Intraday Chart Example
You can see the setup is the same as all the other charts previously discussed, even though the chart is on a 5-minute time frame.
The key point, again, is that you will need to let the trade setup. It’s not like an opening range breakout with 4 or 6 candles after a major gap. It takes time.
This pattern requires you to let the trade come to you, which takes extreme patience. The positive is that the reward from the trade is significant because the “cause” built up before the move creates a large “effect,” typically. There are many traders on both sides of the trade placing real money on the line.
The key is, after the break of the neckline, managing the trade properly. This means placing your stop above the recent peak or trough point. Also, it means adding to the position as it goes in your favor, all while managing a core position.
Key Summary Points on Head and Shoulders Chart Patterns
Head and shoulders tops and bottoms are reversal chart patterns.
It is one of the most reliable technical formations.
Inverted head and shoulders can reverse a bearish trend to bullish.
You will need to identify the formation, neckline, and stop loss levels.
Open a position when the price breaks through the neckline.
Advanced/Early entries can be taken on pops into the moving averages on the right shoulder
Place a stop loss order on the edge of the last shoulder.
The price target for the formation is equal to the depth of the neckline to the head of the formation.
When the price target is met, stay with the position until a contrary signal develops.
The pattern can fail, so don’t get too sure of yourself.
Use a global news source to understand the financial impacts outside of your market which can impact the trade.
How Can TradingSim Help
As with any strategy, we never recommend putting your money to work without testing the setup first. Ideally, you’ll want a set of as many simulated trades as possible in order to know your probability for success.
In other words, don’t take our word for it. Jump in the sim, scan for reversals both long and short, and track them in the analytics page. This way, you’ll know ahead of time what your realistic outcome expectancy can be.
Along the way, be sure to study which areas provide the best points of entry for your specific head and shoulders pattern strategy.
Here’s to good fills!
Rising and falling wedges are a technical chart pattern used to predict trend continuations and trend reversals. In many cases, when the market is trending, a wedge pattern will develop on the chart. This wedge could be either a rising wedge pattern or falling wedge pattern. The can either appear as a bullish wedge or bearish wedge depending on the context. Thus, a wedge on the chart could have continuation or reversal characteristics depending on the trend direction and wedge type.
In this post, we’ll uncover a few of the simplest ways to spot these patterns. Likewise, will give you the best way to predict the breakout and trade them.
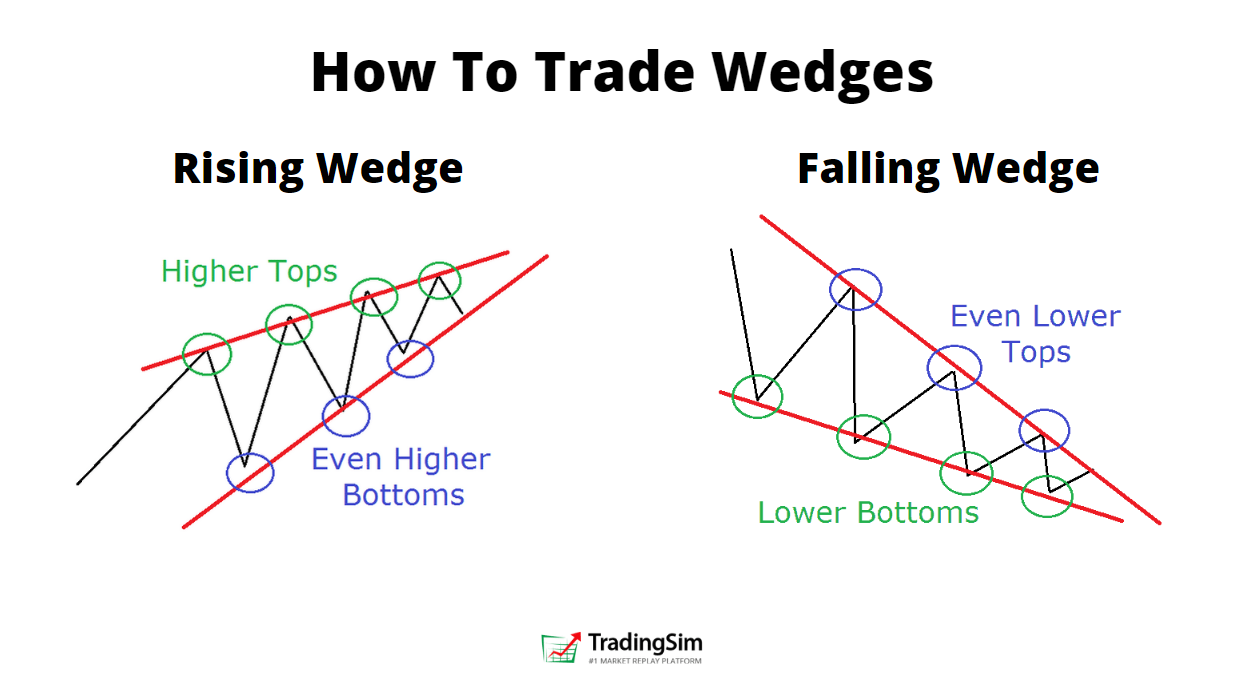
What do rising wedge and falling wedge patterns look like?
Although many newbie traders confuse wedges with triangles, rising and falling wedge patterns are easily distinguishable from other chart patterns. They are also known as a descending wedge pattern and ascending wedge pattern.
Rising Wedge – Ascending Wedge
The rising wedge pattern develops when price records higher tops and even higher bottoms. Therefore, the wedge is like an ascending corridor where the walls are narrowing until the lines finally connect at an apex.
The below image illustrates the rising wedge pattern formation:
Rising Wedge Pattern aka Ascending Wedge
Note that the rising wedge pattern formation only signifies the potential for a bearish move. Depending on the previous market direction, this “bearish wedge” could be either a trend continuation or a reversal. In other words, during an ascending wedge pattern, price is likely to break through the figure’s lower level.
A Bearish Wedge Pattern
Ideally, you’ll want to see volume entering the market at the highs of the ascending bearish wedge. This is a good indication that supply is entering as the stock makes new highs. A good way to read this price action is to ask yourself if the effort to make new highs matches the result.
Along those lines, if you see the stock struggling on elevated volume, it could be a good indication of distribution.
Falling Wedge – Descending Wedge
A falling wedge pattern is an exact mirror image of the rising wedge. As a descending wedge pattern, it develops on the chart when there are lower bottoms and even lower tops:
Falling Wedge aka Descending Wedge
As you can see, the bottoms are decreasing, but the tops are decreasing at a faster pace.
Opposite to rising wedge patterns, falling wedge patterns are typically a bullish wedge, which implies the price is likely to break through the upper line of the formation. Much like our discussion above on ascending wedges, this descending wedge pattern should display the inverse characteristics of volume and price action.
Bullish Wedge Pattern
As a bullish descending wedge pattern, you should notice that volume is increasing as the stock puts in new lows. As this “effort” to push the stock downward increases along the lows, you’ll notice that the result of the price action is diminishing. This is likely due to accumulation efforts.
For this reason, it is commonly known as a bullish wedge if the reaction is to the upside as a breakout, aka a falling wedge breakout.
Predicting the breakout direction of the rising wedge and falling wedge patterns
Let’s be clear once again: rising and falling wedge patterns could result in a continuation or reversal. It all depends on the direction of the primary trend, and the context of the volume and price action.
You may be thinking, “But how is it possible for a pattern to have two very different outcomes?”
The answer to this question lies within the events leading up to the formation of the wedge.
Wedge Stock Pattern – Trend Continuation
During a trend continuation, the wedge pattern plays the role of a correction on the chart. For example, imagine you have a bullish trend and suddenly a falling wedge pattern develops on the chart. In this case, the descending wedge represents a correction. Thus, we expect a price breakout from the wedge to the upside.
The same applies for rising wedge patterns. The difference is that rising wedge patterns should appear in the context of a bearish trend in order to signal a trend continuation. Ultimately, the price action will break to the downside.
Wedge Chart Pattern Trend Continuation Example
Take a quick look at the image below, which shows how ascending and descending wedges behave during a bullish market:
Rising and falling wedge continuation patterns
As you can see from this 10-minute chart of GM, it is in a strong uptrend, which is tested a total of 9-times 9 (the blue line).
There are two falling and two rising wedge patterns on the chart.
As previously stated, during an uptrend, falling wedge patterns can indicate a potential increase, while rising wedge patterns can signal a potential decrease. Notice that the two falling wedge patterns on the image develop after a price increase and they play the role of trend correction.
Conversely, the two ascending wedge patterns develop after a price increase as well. For this reason, they represent the exhaustion of the previous bullish move. After the two increases, the tops of the two rising wedge patterns look like a trend slowdown. Hence, they are bearish wedge patterns in the short-term context.
Conversely, during a downtrend, we have the exact same scenario – price is likely to increase after a falling wedge pattern and price is likely to decrease after a rising wedge pattern. However, since the equity is moving downwards, our rising wedge pattern implies trend continuation and the falling wedge pattern – trend reversal. This is when the two types of wedges switch their roles. Yet, their behavior and potential remains the same.
Here is an example for your consideration:
Rising wedges in a downtrend
Trend Reversal
In different cases, wedge patterns play the role of a trend reversal pattern. In order to identify a trend reversal, you will want to look for trends that are experiencing a slowdown in the primary trend. This slowdown can often terminate with the development of a wedge pattern.
Remember our discussion earlier? The best way to think about this is by imagining effort versus result. Before a trend changes, the effort to push the stock any higher or lower becomes thwarted. Thus, you have a series of higher highs in an ascending wedge, but those highs are waning.
In other words, effort may be increasing, but the result is diminishing. This is typical of a reversal pattern.
Trend Reversal Chart Example
Wedge Trend Reversal Pattern
Above is a daily chart of Google and a 10-minute chart of Facebook showing the exact trigger for entering a position.
Note in these cases, the falling and the rising wedge patterns have a reversal characteristic. This is because in both cases the formations are in the direction of the trend, representing moves on their last leg.
How to trade ascending and descending wedge patterns?
Every wedge strategy has a signal line. Depending on the wedge type, the signal line is either the upper or the lower line of the pattern.
For example, if you have a rising wedge, the signal line is the lower level, which connects the bottoms of the wedge. If you have a falling wedge, the signal line is the upper level, which connects the formation’s tops.
The wedge strategy is simply this: When you see a break in the signal line, you should enter the market in the direction of the break.
For example, when you have an ascending wedge, the signal line is the lower level of the figure. When you see the price of the equity breaking the wedge’s lower level, you should go short. At the same time, when you get a descending wedge, you should enter the market whenever the price breaks the upper level of the formation.
Wedge Strategy – Where should you place your stop loss?
When trading a wedge, stop loss orders should be placed right above a rising wedge, or below a falling wedge. You do not want to make your stops too tightly as the price action will often violate one of the trend lines before rebounding swiftly. Instead, you’ll want to see a real break of significance to know you need to exit your position.
Wedge Strategy – When should you take profits?
The potential price target of a wedge is equal to its size.
This means that if we have a rising wedge, we expect the market to drop an amount equal to the formation’s size. If we have a falling wedge, the equity is expected to increase with the size of the formation.
Below you will see an image showing how to trade a rising and a falling wedge:
Wedge Strategy Trading Example
This is the 5-minute chart of JP Morgan. There are two wedges on the chart – a red ascending wedge and a blue descending wedge. We enter these wedges with a short and a long position respectively.
The overall JPM movement is bullish and the two wedges show a price cycle during a bullish trend:
Price bounces from a trend
Price starts hesitating and closes a rising wedge
The wedge is broken and the price decreases into a falling wedge
Price touches the trend and the falling wedge is broken in a bullish direction
New bullish movement appears
The blue arrows next to the wedges show the size of each edge and the potential of each position. The green areas on the chart show the move we catch with our positions. The red areas show the amount we are willing to cover with our stop loss order.
In both cases, we enter the market after the wedges break through their respective trend lines.
These two positions would have generated a total profit of 80 cents per share by JPM.
How to practice rising and falling wedge patterns
The best place to practice any strategy is in a market simulator. We suggest flipping through as many charts of the more liquid names in the market. Get out your trend line tools and see how many rising and falling wedges you can spot. Draw them, and then make note of the price action on the breakout or breakdown, identifying what made them a bearish wedge or a bullish wedge.
While you do this, analyze the bigger picture context. For example, is the stock in an uptrend or downtrend? What do higher time frames like the 15m, 1hour, or daily chart look like? Also, what does volume look like during the pattern?
Many times, you may find that volume recedes during bearish continuation wedges, while it may increase in bearish reversal wedges.
Over time, you should develop a large subset of simulated trades to know your probabilities and criteria for success before you put real money to work.
We hope this helps, and here’s a quick summary in parting:
Wedges are technical analysis chart patterns.
Wedge patterns could be rising and falling.
Rising wedge patterns usually imply an impending decrease in price.
Falling wedge patterns usually imply an impending increase in price.
Wedges could be trend confirming or trend reversing depending on the previous price movement.
We should enter the market with the break through the signal line of the wedge.
Stop loss orders should be placed above the rising wedge and below the falling wedges.
We should aim for a target of a minimum amount equal to the size of the wedge.
Even if the wedge is successfully completed, we should not close our position if the equity is still trending in our favor.
Finding the Most Active Stocks to Day Trade [Video]
There are thousands of stocks you can trade on any given day. For that reason, picking the most active stocks each day can help you narrow your universe of ideas.
The potential number of trade opportunities can feel overwhelming to the untrained eye. For example, do you pick popular stocks like Apple or Google to trade? Or, do you just play IPOs and shoot for a quick flip based on the hype? All of these questions have to be fleshed out as a part of your daily trading plan.
Each day, it should be your goal of scanning the market for the best “stock movers today.” Your goal is not only finding stocks that best fit your trading methodology, but which are also the biggest market movers. The task is not as simple as just having a list of high volume stocks that you can trade every day and make boatloads of money.
Learning how to find the best stocks to day trade requires work and quite a bit of research on your part. In this article, we’ll illustrate 7 tips and tricks you can use to find the most active stocks to day trade, the biggest pre market movers, and the highest volume stock each day.
Start Your Day Early Searching Pre-Market Gainers
Regardless of which approach best fits your day trading style, the one thing required for each selection process is that you must get an early start to the trading day.
Gone are the days where you can arrive at 9:15 am, log on to your broker, and start placing trades. The market is getting faster and faster with the increased trading volume from hedge funds. At a minimum, you should start your prep work at 8 am market time.
This will provide you enough time to conduct your morning research and configure your monitors with the stocks you are actively tracking for the day. As part of this process, you will want to pay close attention to the pre-market gainers that are populating your scans. These are usually the best day trading stocks.
#1 Find the Best Stocks to Day Trade with Biggest Pre-market Movers
For those of you that have been trading for some period of time, you will know that the pre-market is one of the street’s favorite ways to take advantage of you.[1] A stock could be up 6% in the pre-market only to open up 2% at 9:30 am. The reason for the large price swing is due to the thin volume that can carry a stock in either direction outside of the regular trading session.
We recommend starting your scans around 8:00 am sharp, well before the opening bell. This gives you a full hour and a half before the market opens to conduct your research. Along those lines, here is a list of what you want to look for when scanning for the best stock movers “today”.
Stocks gapping at least 2-5%. The gap needs to be healthy. However, since 2020 and the pandemic, pre-market stock movers are gapping higher and higher
Volume needs to be somewhat heavy. If you see a stock up 20% on 200 shares, then look the other way. Ideally, Relative Volume should be well over 100%
Once you see a stock that is up on decent volume, you’ll want to check the news and whether or not there is any dilution risk.
Make sure you review the broader value of the futures market for the major indices (Dow, NASDAQ and S&P). While breakouts can move independently of the market, it’s always a good idea to go in the direction of the broad market.
Setting Up Your Scans for Today’s Biggest Premarket Movers
Your trading platform should provide you with the pre-market movers; however, if the scans are not thorough enough, below is a list of resources:
NASDAQ pre-market values
Stock Market Analysis – list the pre-market movers every morning
Stock Market Watch – provides top gainers and losers but also displays the pre-market value of the major indices.
There are other high powered scanners out there, but to be honest, all you really need is a method to see the top gainers and losers. However, here at TradingSim, we offer a simplified scan filtering engine that will help empower your training experience. There’s no better way to get your feet wet finding the biggest premarket stock movers.
TradingSim Scanner Tutorial
The constant need for more information throughout the day will likely lead to overtrading or too much confidence.
Not to mention, some of these scanners can get pretty costly. You need to prove you are able to make money with the most basic of scans before scaling up to the pricier options.
Examples of these pricier scanning options are Trade Ideas and Finviz. What these sites lack in design they more than make up for in their ability to provide you with more scans than you can ever dream of needing.
Choosing the Best Penny Stocks to Trade?
Now that we have covered the more conservative point of view for pre-market trading, let’s delve into the wilder side of trading – low float stocks.
Low float stocks are not for everyone as the price moves are significant. [2] These low float stocks are likely penny stocks that trade under $5 dollars. Since the covid crash of 2020, these penny stocks have become much more popular and liquid. Some of them may reach into the 100s of millions of shares traded. However, they can be risky.
Please note, if you go down this path, do not use more than 5% or 10% of your bankroll on each trade. This is more of a game where you play the pop, but you are not making a long-term investment. Odds are that these stocks are priced cheaply for a reason and will eventually drop quickly.
For an example, check out our article on the 1-3pm Bloodbath Setup. It’s a great way to play penny stock movers to the short side.
Find a Clean Pattern with the Highest Volume Stocks Pre-Market
As we mentioned earlier, you want to avoid charts that have low volume in the morning. How do you know you are dealing with a chart with low volume? Just check out the image below.
Thin Volume
Basically, if you feel like you are looking at stars in the midnight sky, the volume is too thin. When we say stars, we’re not talking about candlesticks – we mean literal dashes on the charts.
The pattern you trade is solely up to you. Some of you may like ascending triangles, while others may look for red to green setups (meaning the stock starts lower but later exceeds the morning highs).
Scanning for the Biggest High Float Market Movers Each Day
If you’re not interested in low float penny stocks, you’ll want to find the highest volume stocks with high float. Why high float?
These are the stocks that can safeguard your investment with a more certain move in the morning.
On average, you’ll find between 2 and 5 stocks that have both the volume and the necessary float requirements to be a real market mover.
The key for you is only trading one or two of these setups per day.
Running your scans, you should see a list of stocks like the one below:
Pre Market Movers
As you can see, there are a few stocks on both the long and short side that are likely good candidates for an opening range breakout or breakdown trade.
Now that we have covered pre-market movers at length, let’s shift our focus back to other ways of identifying great day trading opportunities using the most active stocks of the day.
#2 Finding the Highest Volume Stocks Today
Assuming you have hundreds of thousands of dollars at your disposal you will need a stock with enough volume to allow you to quickly enter and exit the trade with ease. Everyone’s criteria may differ, but our personal minimum is about 40,000 shares per 5-minute bar.
This, of course, depends on the price of the stock and the float. Perhaps you don’t have a large account. If not, be sure to check out our small account strategy.
If you have a brokerage account, your respective firm should have a most active stocks list. This is a good place to start, but will only contain the top 20 or so stocks. You’ll need a scan that is a little broader and provides you with trading opportunities that are not being tracked by every investor. You may want to also find stocks that are rising on high volume relative to their average volume.
For example, if a stock normally trades 2 million shares a day but has 5 million shares traded before 10am, this is something of note. You may be saying to yourself, well these will show up in the most popular stocks in my trading platform. Unfortunately, this is not always the case. Again, your brokerage platform may only return a maximum number of stocks (i.e. top 10, 20).
If your trading platform does not provide you with a robust screener for the highest volume stocks, below are some great resources:
The Street provides not only the high volume stocks but also has a scan for stocks trading under $5 for all you penny stock lovers out there [5]
#3 Develop your Own Watchlist for Daily Market Movers
You will need to develop your own list from stocks you follow on a daily basis. Again, due to a large number of stocks on the exchanges, it’s best to focus on specific sectors. Below is a list of popular ones:
Banking
Precious Metals
Semiconductor
Automotive
Pharmaceuticals
Retail
Internet
Once you have one or two sectors you would like to follow, begin to track the movement of the top issues. Give yourself a few months of consistently watching the stocks and the sectors in terms of their price movements.
As a follower of the Richard Wyckoff method, you’ll learn that each sector and stock will have an ‘operator’ that is in control of the market action. This operator is the collective investors or market makers with the most money in the stock; therefore, they have a controlling interest.
Using Gold as an Example
Let’s take an example from the ’08 market.
Every day like clockwork stocks Royal Gold (RGLD) and Golden Star Resources (GSS) would have sharp reversals at 10 AM. A system of buying or selling short on breakouts of the morning’s trading range would fail consistently with these precious metal stocks.
While experience would’ve taught you to avoid this particular sector for 6 months, you could use the watch and learn approach to understand how a particular market moves in order to gain an edge over other traders.
The one challenge with building a list is limiting the number of stocks you watch within 1 or 2 sectors down to the biggest market movers. You are manually tracking these stocks and building a sense of touch for how they trade. At most, you should only track 10 stocks per sector, so this gives you a maximum of 20 stocks you can follow at any one point.
This should give you a feel for not only the stocks in the sector, but if they are real stock movers, and whether or not they fit your strategy.
#4 Keep Up with Historical Market Movers
Instead of looking to someone else for advice on what the best stocks to day trade are, how about looking at your own trade performance. There is at least one stock you trade on a regular basis for one reason or another.
Funny thing is you will not be able to explain why you keep gravitating to that particular security. Call it your soul mate or just your stock of choice. Your comfort level with the stock will make you feel like you “own” its movements.
You can move in and out of the stock with ease and generally make a profitable trade on each attempt.
For me, I couldn’t get enough of Baidu Incorporated (BIDU). For all of you fans of the show Scandal, she was my Olivia. I would track BIDU every day even if she wasn’t moving much. For some reason, I was able to predict her movements and never found myself fighting the trade.
So, look back over your trade history. Is there one stock market mover that keeps popping up on your list of trades?
#5 Social Media Stock Movers and Pumpers
This is a more recent technique for scanning the market. It can be a bit tricky, however. The reason for this is that searching social media sites or reading news events might positively or negatively impact your view on a stock.
We recommend basing your trade decisions solely on the price and volume action of the stock. That being said, there may be some underlying sentiment on social media that is worth knowing.
Play StockTwits
StockTwits streams the hopes and random thoughts of investors for many securities. They even have a market sentiment factor which displays at the top of each wall for the respective stock.
In terms of which stocks most active stocks to day trade, if you visit the homepage you will see a list of stocks across the top which are trending.
These are stocks that members are actively discussing as Stocktwits plays. You will quickly notice that these are the stocks in the news. Nonetheless, there are times when members are discussing a move in a stock during the middle of the day before a news publication is able to produce an article.
Play Stocktwits for most active stocks
The best method for using StockTwits without a doubt goes back to the list of pre-market movers. You can, of course, look at the news event which is pushing the stock higher or read the latest press release from the company, but StockTwits allows you to get a real pulse of the market.
You can actually use StockTwits as a method to validate exactly how much interest there is in the stock.
If you see a stock up 10% but with only two tweets, it’s likely not in play.
However, if you can find the stock that is up on heavy volume and the board for the respective security on StockTwits is very active, you likely have a stock in play.
Remember, it’s not about the level of bullishness or bearishness on the board – all you care about is if people are talking about the stock you have an eye on.
Swaggystocks.com Popular Active Stocks List
Similar to StockTwits but with a twist, is the popular sentiment lists being viewed on swaggystocks.com. Swaggystocks essentially crawls many of the popular social media outlets like Twitter, WallStreetBets, Reddit, and more. They compile the most mentioned stocks into cute little charts that tell you what’s trending.
swaggystocks.com social media sentiment lists
The cool thing about swaggystocks.com is that they offer many different social sentiment lists that are updated frequently throughout the day. What this can do for the retail trader is give insight into what stocks are most active. You might find a potential market mover or high volume stock from this list.
Of course, as with any stock in play, you want to have a setup and a trade plan. Don’t be a bag holder just because AMC is being mentioned a lot on Twitter. Stick to your edge.
TradingSim Historical Market Movers Scanner
TradingSim’s market movers scan provides a list of the top 50 losers and gainers for every session in the market going back 3 years. For most brokers, they don’t keep track of this data. To that end, you’ll have a tough time identifying which stocks were trending on a given day in the past.
TradingSim Market Movers Pane
Market movers inside TradingSim will allow you to pick a random day 6 months in the past and actually see what the most active stocks were for that day. Just as you would research and track the hot stocks for each morning, market movers automatically provides this function for you on historical days. This way, you can just focus on practicing day trading.
#6 Monitor the Earnings Calendar for Potential Active Stocks
One event that is sure to bring about increased volatility is the reporting of earnings. This occurs quarterly throughout the year.
Be sure to keep track of who is on deck for the week. That way, you can start to monitor how the stock is trading going into the earnings announcement.
To be clear, we are NOT advocating you place a trade before the earnings are reported, because this is another form of gambling. You will, however, want to know who are the upcoming market movers and most active stocks for that day, so you can add them to your watch list.
This will reduce the amount of research required prior to the market open. Below is a list of sites that publish earnings calendars:
#7 Focus on One or Two Stocks from Your Most Active Stocks List
Focusing on one or two securities is all about keeping it simple. In all of the above examples, you would need to scan, watch, and react quickly on a daily basis to a large number of issues.
If this is something that you feel is too much and you want to become a master of something simple, then look to trade the same one or two issues every day. Or, at a miminum, choose only a few of the highest volume gainers or most active stocks each day.
Selecting a Stock to Trade from Your Most Active Stocks List
When selecting a stock to trade, you have two approaches: (1) select the most popular stock or (2) pick your favorite stock based on your past trading performance. #2 will largely depend on your own trading preferences, so we’ll cover a few top stocks for day trading:
AAPL (Apple) – high volume and great price action. The popularity of the company has transferred over to the stock’s popularity in the trading community
S&P 500 Spiders (SPY) – While this is not a stock but an ETF that follows the S&P index, the volume is huge and provides the means for you to trade the index without trading futures
QQQ – formerly known as the QQQQ has been a fan favorite of active traders for over a decade
TSLA (Tesla Motors, Inc.) – if you like volatility, the stock moves as fast as its cars
NFLX (Netflix) – the CEO is willing to make bold decisions, this has translated into significant price swings in the stock
FB (Facebook) – there are few stocks that have polarized traders as much as Facebook
It’s safe to say we are a little biased towards the NASDAQ when it comes to day trading. The NASDAQ’s ability in the late 90’s to facilitate order flow has forever stamped them as the preferred index for active traders. You’ll typically never fall short of a daily market mover or high volume stock on the NASDAQ.
Below are the benefits of trading one or two stocks:
Learn the trading pattern and personality of the stock
Identify the technical indicators best suited for the security
Less stress
Less work to do before and after the market close
In Summary
There are multiple ways to select the best stocks for you to day trade. Remember, trading is a journey, so don’t try to figure it all out in one day. Just make sure your scan provides you the means to trade high volume stocks with a sound system that consistently makes you money.
If you do decide to create custom scans, you will want to focus on the following key areas:
high volume stocks
gappers
pre-market movers
red to green and green to red moves
consecutive number of red or green candles
biggest stock gainers and losers
Results for these 6 scans will provide you more than enough as a new trader.
We hope you found this article to be helpful in your quest to find the most active stocks to day trade. If you would like to see how we can help you further, come over to Tradingsim.com and give our market movers a shot. We’re sure you’ll find our top stock mover tips useful.
So you want to be a day trader? You want to make that fast money? We get it. Who wouldn’t, right? Well, before you jump in head first and start pushing buttons, give us a bit of your time to discuss everything you need to know, first, in this beginner’s guide to day trading.
Day Trading 101
The Lure of Day Trading for Beginners
Success theatre has made a big impact on the lure of the average Joe into day trading in recent years. The constant barrage of juicy wins being shared on Twitter and YouTube these days make it sooo tantalizing. After all, if Jimmy Guru could go from barista to baron in just a few short months, surely he can teach you how to as well?
All kudos to Jimmy Guru, but the reality of day trading is that it’s very difficult to reach a high level of success. It’s then even harder to maintain that level of success.
Nonetheless, we are in the business of helping traders reach that success, so don’t get the wrong picture. We believe it is attainable. And, for the right person, we believe it is worthwhile.
That being said, our goal in this beginner’s guide to day trading is to paint a realistic picture for you, rather than the pomp and glamour you’ve been exposed to. Along the way, we’ll give you some valuable insights into what to expect, what you should know, and what you should avoid.
What Is Day Trading?
Day trading is simply the buying and selling of a security, asset, or commodity in the same day. Holding positions overnight is what we call swing trading, and that’s a whole other discussion.
Simply put, if you open a trade in the market, then you close it the same day, you’ve made a “day” trade.
This can apply to stocks, currencies (forex), futures, crypto, or anything else that’s tradable on the markets. It doesn’t really matter.
How Much Do Day Traders Make?
This is a bit difficult to say. Honestly, most day traders don’t make money…they lose money. However, professional traders, we have written a great article that outlines a typical day traders salary here.
Online, you’ll be quick to find many YouTube videos and gurus who’ve made millions. Their results are not typical, and can be difficult to replicate. In fact, many of these gurus are suspect regarding their trading practices, knowing they have so many followers who may buy a stock based simply upon their recommendation.
All in all, a great way to think about this is to see how little you need to make each day in order to meet your financial needs. Here is a great tweet from a market veteran on how little it takes to make a living, if you’re consistent:
252 trading days per year: $200/day = $50k/year $400/day = $100k/year $1k/day =$250k/year $4k/day = $1M/year
Notice it doesn't take much to make big money! CONSISTENCY is the KEY! Gains add up quick when u don't have wild big swings (losses). Stick to your plan/rules daily!
Along those lines, we don’t recommend focusing on how much you can make, but on your process. We’ve done a few great interviews with guys who’ve gone from $1500 to almost a million in a short time. Be sure to check those out on the SimCast!
What Does It Cost To Day Trade?
Aside from the risks of losing money, you can day trade nowadays for practically free. Most brokers will offer free trading. However, not all brokers are created equally.
If you’re planning on day trading with precision and larger share size, you will eventually want a quality platform.
The drawbacks to having a quality platform, which doesn’t sell your order flow, is that you will pay commissions and fees.
There are a few different ways that this can be calculated depending on the broker:
Per-Trade Commissions in Day Trading
Per-trade commissions are usually calculated for low volume traders. Typically, the per-trade commission standard is around $5-$7 dollars per trade.
So, think about it this way. If you place 20 trades in a single day, you’ve racked up around $50 or so in commissions.
Obviously, for small accounts, this can add up quickly. For that reason, you want to either limit the amount of trades you make, or have enough starting capital to support these costs.
Per-Share Commissions in Day Trading
Usually, the per-share commission structure is applied to traders with larger accounts and higher frequency trades. The rate can be as low as $0.002 per share. Most brokerages will have a tier system depending on the amount of shares you trade.
The more you trade, the lower your per share commission size, typically. As you can see from doing simple math, it would take 1000 shares to add up to a $2 commission.
In addition to commissions, there are ECN fees, and other items to consider. Once you become more proficient at trading, you can even get rebates depending on how you route your orders.
Why Day Trading Is Attractive
Unlike swing trading or long-term investing, day trading can provide opportunities to make high percentage gains in a very short amount of time.
Think about it this way. If a stock has the ability to move 20% in a single day, would you like to capitalize on that opportunity? Or, would you rather wait days, weeks, or even months for a stock to reach 20% in gains?
Therein lies the temptation.
Everyday in the market, there is usually an opportunity for a stock to make a big move. Seasoned day traders know how to anticipate these moves based upon volatility and momentum. Add some amount of leverage (margin) into the mix and you have a recipe to either increase your account exponentially in a short time, or lose it all.
Sounds a lot like gambling doesn’t it? Well, we’ll discuss that next.
Is Day Trading Gambling?
In short, it all depends. Day trading, or any other trading for that matter, when done properly, is a game of probabilities. Most new traders don’t understand this, no matter how many times you tell them.
To new traders who are itching to make millions — the faster you can get there, the better. Unfortunately, this leads to gambling.
Irresponsible gambling is throwing a bet on something with no idea what your outcomes may be for success. Your “odds,” so-to-speak. When you don’t know your odds, you’re at the mercy of happenstance. Who knows where the chips may fall, right?
So it is with trading. If you trust a guru with your money to tell you what is going to work and what isn’t, how did that guru earn your trust? Did he/she provide the probabilities of a successful outcome with you?
If not, what are you trusting in?
Likewise, if you take a trade based on a hunch, or “to see what happens,” you’re essentially gambling. You might as well be in Vegas.
Gambling vs Probable Outcomes
The difference between blindly gambling and successful trading comes through a deep understanding of your probable outcomes. Using the example above, if we throw a bet on something we know has a 75% chance of success, we are no longer gambling.
The trick is figuring out what variables and patterns play out in the markets, time and again, in order to find these outcomes. Once you do, you are armed with an edge – a strategy. The rest is simply monitoring your position size and growing your account over time by keeping your risk in tact.
Discovering Your Edge Before You Start Day Trading
To avoid gambling your hard-earned money or life savings away, this may be the most important aspect of your budding career in trading — discovering your edge.
Lessons from Jesse Livermore
There is a famous trader that you may or may not have heard of by now named Jesse Livermore. In a book that profiles his life, he says the following:
“The game taught me the game.”
Bucket Shops – Photo taken from The Life & Death of Jesse Lauriston Livermore – Beyond Debt
Livermore grew up working in what were called bucket shops. They were local trading rooms where you could place bets on the market. Back then you were basically all in. Every trade was all or nothing.
Having worked there for so long, Livermore began to see patterns play out in the prices of stocks as they were printed on the “tape.” Before long, he began betting on these patterns, and winning handsomely.
Observe Before You Bet, Look Before You Leap
The reason we mention that story is twofold:
If you spend enough time observing the markets, you’ll discover an exploitable pattern that can make you a handsome living.
Skip this integral part of your journey, and you’ll spend a lot of long, hard years suffering set back after set back.
Observation and discovery are the keys to your success. We believe it so much that we created a niche market discovery tool that allows you to replay the entire market for up to three years.
Ponder this for a moment:
Let’s assume you’re a soldier and you have a mission to accomplish. Would you rather jump out of an airplane into enemy territory with no prior knowledge of the terrain, the enemy, the target, the climate, or the language; or, would you rather train for a few months on what the enemy looks like, the compound where he may be hiding, how many guards he has, the terrain you’ll have to traverse, the language of the people, etc.?
In which scenario will you be more successful? Which one is more of a gamble?
Day trading is not a safe market for an uneducated trader to put his money. It’s dangerous. Literally speaking, 94% of traders lose money in the market over time. Let that sink in.
How to Find a Strategy for Day Trading
All that being said, there are a few ways to go about discovering an edge for day trading. Like we just mentioned, you can observe enough market action until you see a repeatable pattern. Conversely, you can study a guru who has published his/her own strategies.
We are big proponents of as much original observation as possible. However, we also believe that the learning curve can be drastically reduced through quality and trustworthy education, like good podcasts for example!
In the end, though, your “edge” needs to be yours, no matter what bits and pieces you learn from here or there.
Step 1 for Discovering Your Edge in Day Trading: Patterns
You should also study candlestick patterns. We have a great guide for these.
Regardless of the pattern, the same ones that have been documented for years and years still play out in the market every single day.
Along these lines, start observing the biggest moves in the shortest amount of time. What happens when stocks gap up or down on large volume? Can you find predictable volatility in order to exploit a large intraday move based on what you find?
At the end of the day, the goal of a day trader is to make the most amount of money in the shortest amount of time, all while managing risk. In order to do this, you must find the largest, yet most predictable, price swings intraday. That’s it.
Find enough of these, and you’re well on your way. We’ll discuss a few strategies in a moment.
Step 2 for Discovering Your Edge in Day Trading: Picking a Side
Once you find a pattern, pick a side. In the beginning, it will help you focus by choosing the long side or the short side. The goal here is to become consistent. It doesn’t mean you’ll stay a bull forever, or a bear forever.
To a beginning trader, flipping your position here and there and then back again can be utterly confusing and confounding. Therefore, pick a side. If you see a pattern of low priced stocks gapping up and then failing, maybe shorting is better for you.
To the contrary, if you’re a more optimistic personality, perhaps you like the long side. Either way, it’s best to pick a side in the beginning, then study it until you’ve mastered it. You can always add strategies further down the road.
Step 3 for Discovering Your Edge in Day Trading: Backtesting/Outcome Testing
Like we said earlier, you’re only as good as your known probable outcomes in the market.
As the late Mark Douglas once said, “anything can happen” in the market. Day trading is often risky and is never certain. There is no edge that will have a 100% win rate, ever. If there were, we’d all be rich.
Understand that losses will be a part of your experience more often than not. Unless you can embrace this, your odds for success are slim. It all boils down to testing your outcome for a specific strategy.
For example, if you know that stocks with a float size of less than 20 million that gap X% on Y million shares of volume have a Z chance of breaking down after 10am in the market and will close lower than they opened on the day 70% of the time, then you can place your bet knowing your probable outcomes.
30% of the time you’ll be wrong. Then it becomes a matter of managing your position size each time.
This is just one example, but there are myriad examples like this. The bottom line: test the pattern you see with as much data as you can and with as many examples as you can.
Then, narrow down your criteria for entry, rules for trade management, and criteria for exiting the trade.
This is where true confidence comes from in trading. Don’t take our word for it, take Qullamaggie’s word for it.
The Importance of Simulation and Paper Trading
Simulation plays a huge role in day trading, mainly because it allows you to backtest and outcome test much faster. Trading live each day will take you many years to accumulate the amount of chart/screen time necessary to build pattern recognition in your mind.
Not only do you want to rely on your data, but you also want to rely on your “chart eye.” Your chart eye becomes a necessary component to your trading, unless you are a systematic/algorithmic trader.
Most traders are not algos. They are discretionary. However, as discretionary as many traders may seem, the repertoire of patterns they have become accustomed to essentially becomes systematic.
You learn what qualities you need to see in volume and price action before you put on a trade, for example.
With paper trading, time is condensed. You can trade whenever you want, testing as many strategies as you want, on as many tickers as you want. And if the platform is complete, you’ll be able to track your strategies in an analytics page, like we provide here at TradingSim.
Don’t listen to the naysayers who will tell you that paper trading doesn’t prepare you emotionally for the real environment. The most successful traders in the world will tell you differently. We’ve already debunked this myth with the most prolific trading psychologist in the world.
It’s all about discovering your probabilities. That is what builds confidence.
The Pattern Day Trading Rule and What It Means for You
When getting started in day trading, a lot of your success may actually depend upon whether or not you’re affected by the Pattern Day Trading rule (PDT). This rule limits the amount of day trades you can make in a week if your account is below $25,000.
On a margin account, you’re only allowed 3 day trades in a 5 day period. So, if you make 3 day trades in one day, you’ll have to wait 5 days to make another.
We discuss ways around this and the potential for international brokerages to free up your available trades, but you need to understand how this can affect your performance.
You’ll be more inclined to hold losing trades because you won’t want to burn a day trade.
Unless your strategies are built on high win rate and high profitability ratios, it may take you a looooong time to get over PDT.
If you can find access to a brokerage that allows you trade freely, you’ll have to exercise discipline to overcome the “over trading” habit.
As you can see, there are quite a few caveats here, but at the end of the day your success will revolve around two things:
Your ability to trust your edge/strategy
The ability to stay disciplined enough to only trade your edge
That being said, whether you’re affected by the PDT rule or not, the goal is the same. Only trade the highest quality setups that you’ve tested well enough to trust.
Lastly, if you place more than 4 day trades in a 5 day period, know that you will be flagged as PDT. If you don’t top up your account, you’ll have to wait 90 days, or apply for a waiver in order to trade again.
How Much Money Should You Start Day Trading with?
This is a tricky question. On the one hand, if you are above the PDT rule mentioned above, you should have plenty of money to make a good living at this. If you are under PDT, you’ll likely need more time.
At the end of the day, it doesn’t really matter how much money you start with. In fact, we recommend starting small if you can. If you’re above PDT (above $25,000 in your account), then you may be prone to trade with large size.
Likewise, if you have an international broker, you might be able to start with only $5000, but not be affected by the PDT rule. Fees and commissions aside, we like to say that if you can’t make it with $5k or $25k, you won’t be able to make it with $100k.
Granted, the amount you have to trade with may influence the types of stocks you trade. Larger accounts can capitalize on the slower moves of larger stocks and still make good money. Whereas smaller accounts can get in and out of smaller stocks that give bigger intraday gains.
Cash or Margin for Day Trading
This is a great question for beginners, especially depending upon whether or not you’re under the PDT rule.
Using Margin
Using a margin account has its benefits if you want to trade more. Essentially, this allows you to trade as often as you want, granted you aren’t affected by the PDT rule. It can also give you up to 4x or even 6x leverage on your buying power.
But, before you think about this as a blessing, it can often be a curse if you don’t know what you’re doing.
Here are a few other key points for margin accounts:
If under PDT, only 3 day trades in 5 business days
Potential to lose more if on leverage
Can buy more shares than a cash account
The ability to also open a cash account
Using Cash
On the other hand, cash accounts allow you trade with your available cash only. Each trade you make will take two days, plus the day you traded, to reconcile. For this reason, you might consider having two accounts open as cash accounts.
This will allow you to place more trades.
Here are a few key points for cash accounts:
The ability to place more trades by using less of your cash per trade
Can be opened with a margin account, giving you two accounts
No leverage, so less risk
If you place a trade with unsettled funds (T+2), then you could get suspended
All in all, there are pros and cons for each. It really all boils down to how much money you have and how disciplined you are no matter what kind of accounts you open.
For more information on cash versus margin accounts, click here.
Tools of the Trade
Like any job, you will want quality tools to enable your success. While some people are able to make money simply using their phones and a Robinhood account, the best traders prefer quality tools.
Let’s look at a handful of things you’ll need to get started:
A Decent Computer
Unless you want to day trade on your phone, or by calling in orders to your broker (really old school) you’re going to need a laptop at a minimum. It can be difficult to navigate order flow on a phone, and you should be able to see charts and Level II data to make your decisions.
Many brokerages nowadays use both Windows and Mac for their platforms. That being said, Windows is much more prevalent for many brokers. You can, however, run Windows on a Mac with Bootcamp or a virtual desktop application.
That being said, if you decide to run multiple screens and chart windows, you’ll want a computer with a decent amount of power to support all of that. Consider using the most recent processors available, consult with the computer company about your plans, and you’ll find one that works for you.
Multiple Monitors
Not every trader likes to trade with multiple monitors, but as a general observation, most professional day traders do. There are plenty of options available from vertical screens, to curved gaming monitors.
Whatever you decide, just make sure you understand that more screens and more charts is not always best. Sometimes less is more.
At the end of the day, it is about what works for you. If you want to monitor multiple tickers, news sites, fundamental sites, chat rooms and more, then maybe you need more monitors. Sometimes cutting out the noise and having fewer screens can be beneficial as well.
A Brokerage Account and Charting Platform
Most brokerages provide you with a charting platform. However, some will charge you for using the platform.
There are handful of options like Sterling Trader Pro, or LightSpeed, among others. These platforms are considered high end day trading platforms that connect with multiple brokers to provide fast order execution.
Other brokers like WeBull, or ThinkorSwim, or Interactive Brokers have their own charting and order execution platforms. They offer free options as well. It will be up to you to decide which one is best for you.
Despite the plethora of brokerage platforms, many traders opt to use a secondary charting platform outside of their brokerage. The most popular platform for this is TradingView.com.
Essentially, this allows you to chart on one platform and trade on another.
Morning Scanners
In addition to a charting platform, you need to make sure that your system comes with a quality scanner. This is imperative for day traders who are looking to find high quality momentum setups intraday.
Many scanners will show you the highest % gainers or losers on the day, along with the highest volume or most active symbols. The best scanners will allow you to filter your resutls according to your strategy criteria, like float size, market cap, etc.
Here at TradingSim, we are one of the few simulators that allows you to replay the market with a live scanning engine. Here is example of some of the features in our scan filter.
TradingSim Scanning Filter
A Paper Trading Simulator that Allows You To Use Replay
The last tool we will mention is the ability to replay your trades. So many great educators and traders recommend recording your screens while you trade, like Nate Michaud. The reason for this is that it’s great review.
When you can replay the market, you can relive the experience and make notes on what you can do better next time. Maybe you missed something in the Level II or Time and Sales. Whatever the case may be, review is done best through replay.
Our Favorite Day Trading Strategies for Small Accounts and Beginners
Let’s be clear, you can find a million different ways to make money in day trading. There is is no right way or wrong way. Nonetheless, what is most important is that you find a strategy that you can master.
As the old adage goes, you don’t want to be a jack of all trades and a master of none. This is doubly true for the stock market.
Along those lines, here are our two favorite strategies for growing a small account, one for the long side, and one for the short side.
The Intraday Volatility Contraction Pattern
We talk about this strategy in depth in this article. It is essentially a fantastic way to keep your risk defined to a certain level while going long anticipating a breakout intraday. Typically it is more of a continuation pattern. Here are the 5 things to look for before the setup forms:
For the setup you want to look for a nice momentum burst off the open, followed by a tightening or contracting in the base. As each consecutive higher low forms, it gives you an opportunity to enter long and risk to just below the prior higher lows.
To time your entry, we like to use the volume and price analysis that Gil Morales teaches. Here’s an example of what this looks like inside Tradingsim:
NTEC VCP with VDU and Pocket Pivots
Notice that you can take the entry on the pocket pivot after anticipating a launch higher after the volume dry up.
This often leads to very large gains in relation to the risk you have. Here is what NTEC did on this particular trade:
High reward to low risk
As you can see, this setup provides a very low risk to high reward, exactly what you want as a trader.
In the world of low float, low-priced stocks, most of the momentum you see eventually fizzles. It’s true that most of these companies are not financially sound and are simply using the market as a tool to raise money.
As astute traders, it is our job to not believe the hype, but to trade the reality. on that token, the reality is that most penny stocks will pump and then dump through a means of diluting the shares.
One great way to take advantage of this is by anticipating the “dump” phase. After watching these pumps over and over again, you’ll begin to notice that many of them will clear out the long chasers and early shorts, then dump the price towards the end of the day.
Here is what the criteria looks like:
One example of this occurred on ticker COCP. This symbol was a low float ticker that was up over 273% intraday. It had a high chance of dilution, and announced an offering after 1pm on the day of its big run.
Notice how the stock was trying to breakout to new intraday highs shortly after 1pm.
Shortly thereafter, COCP announced an offering at $1.54 per share, much lower than it was trading. It had an open shelf offering, which alert traders would have known about.
The result of the offering announcement was devastating. It lost half its value you in a matter of minutes.
COCP 1-3pm bloodbath
Clearly you can see that this didn’t workout well for breakout buyers. As a great additional resource, we recommending studying this setup through the articles found here.
Getting Started as a Beginner in Day Trading
Now that you understand many of the basics about day trading, we encourage you to proceed with caution. This is a marathon, and not a sprint. Keep your expectations low, and your effort high.
To that end, we recommend the following activities as a summary of steps to get going:
Devour as much education as you can in 6 months to 1 year.
Find a solid mentorship program
Begin day trading in a simulator for the first year.
Only put real money to work with a broker when you can prove you have a profitable system in a simulator.
Tweak your system and manage your risk over time
Add to your system with new strategies only once you can provide enough income for your needs.
Feel free to reach out if you need help at [email protected]. We’d love to hear your feedback!
Despite what you may have been told, simulation trading can increase your chances of becoming a consistently profitable trader. It’s all dependent upon on how you use your time in the software. Here’s why.
As we’ve covered in recent articles on the top 4 simulators with replay, and the big myth behind paper trading, if you come to trading as a beginner with the attitude that simulation doesn’t correlate with real-world performance, you’re misguided. However, if you simply use simulation trading for fun, or in an undisciplined and unstructured way, you’ll likely never reach the potential you wish for. That is, not without a lot of loss and heartache and time spent.
This is the type of thing that comes with passion. Are you passionate about studying the markets and putting in the time and effort needed?
If you’re motivated to learn and master markets, you’ll enjoy simulation and playing with trading ideas. If you’re motivated by making money and showing off pictures of your new cars on social media, simulation won’t hold much appeal.
When surgeons learn new techniques, they practice on models and cadavers before “going live”. If a surgeon told me he didn’t think such practice was important, I’d likely look elsewhere for my procedure….
Dr. Brett Steenbarger, PH.D.
To that end, we want to help you shorten your learning curve by discussing four best practices for simulation trading that will likely increase your chances of success.
Simulation Trading Best Practice #1: Screen Time and Exposure
There is one thing all stock educators and gurus agree upon. The amount of screen time you accumulate studying the markets will likely correlate with your understanding of trading. It might not cause success, but it will certainly help.
The more screen time the better. Don’t take our word for it, just listen to Jack Tacher in our recent podcast talk about how many 1000s of charts he reviews. Well, we couldn’t agree more. But the problem is that there are only certain hours of the day in which you can trade markets. The New York Stock Exchange opens at 9:30am and closes at 4pm.
What if you are getting into trading part-time? Can you really put in the focus you need when your boss isn’t watching your cubicle? It’s hard to place trades while waiting tables, building a house, or meeting with clients.
Simulation Trading Is Available On Your Schedule
While not all simulators will allow you to trade in a realistic market environment outside of normal trading hours, TradingSim, does. We’ve also reviewed a handful of other simulators with replay here. The benefit of these applications is that you can essentially push play, like a DVR, and study the markets in the evening, the weekends, or whenever you want.
Regardless of whether or not you can trade the open, it allows you even more screen time. Perhaps you didn’t see certain stocks that ran during the day. After all, you only have so many screens and so many eyes. But the market has 1000s of stocks.
Simulation trading allows you to go back and see what you missed with the intention of finding these opportunities better in real time.
This leads us to our next point: the importance of review.
Simulation Trading Best Practice #2: The Importance of Review
If screen time is a prerequisite for success, then review has to take the #2 spot. It’s imperative. How else will you know where you went wrong?
Reviewing trades and performance reveals so many underlying issues with our trading that are simply overlooked in the heat of the moment.
Dr. Brett Steenbarger has this to say about reviewing trades:
Good reviews give you fresh views. Good reviews help you see new things in the markets you trade and in how you’re trading them. If reviews aren’t providing you with insights, they probably aren’t providing you with learning.
Dr. Brett Steenbarger Ph.d.
Along those lines, one of the best ways to review is to get into the simulator and replay the market. Replay your trades. Relive the experience. Observe what’s going on around you in an effort to discover insights and new ideas. Watch the Level 2, Time and Sales, or other key elements of the trade to find patterns and key areas.
How to Use the Simulator for Review
According to Steenbarger, there are three things you should be aware of when reviewing trades.
Don’t review too much
Create actionable insights
Revisit your goals and takeaways
This sounds really simple. However, many traders create information overload by observing and reviewing waaaay too much data. As we will touch on in a moment, the goal of the sim is to boost your confidence in a strategy. For that reason, be focused in a specific area of the market.
Good review doesn’t really do much for you if you don’t takeaway insight from that review. Watch your trades in replay, study the Level 2, but make notes about certain things you see. Was there a large order being pulled before the flush? How did volume react at certain levels or certain times? Make notes for your next trades.
Lastly, keep your notes and your progress handy. The point of goals is to achieve them. But without incremental steps and a solid process, goals become elusive. Remind yourself to check in with your progress on the action items you create from reviewing.
Simulation Trading Best Practice #3: Backtesting Patterns in the Market
This best practice is an extension of the first two. You’re not going to discover a pattern overnight. Sure, your guru may have found a pattern, but how do you know it works? Did you see her excel spreadsheets? And more importantly, how did she find that pattern?
The bigger question, if you have some sort of pattern in mind (and there are many…), is how you will know the probability of its success. What makes that pattern work? What makes it fail. Herein comes the need for a simulator.
As successful traders like StockBee and Qullamaggie have written, a simulator allows you to see 100s, if not 1000s of patterns in the market. In other words, backtesting. On that token, we’ve written an article about how to find a setup of your own. We’ll share a few tidbits from that article.
Things to Consider When Backtesting Your Strategy in Trading Simulation:
Is your personality suited for the long or short side of trading?
Do you like swing trading or shorter term daytrading?
What patterns do you see on your charts? Gap and go? Gap and fail? Mean reversion?
What is the float, market cap, price, and average volume of the biggest winners?
If day trading, what time of day does your setup work best? Worst?
Does volume predict anything in your setup? Compared to float?
What about short % of float should you consider?
Do fundamentals like potential offerings or dilution have any affect on your strategy?
What do you observe in the tape intraday during the pattern you have observed?
How do your successful trades’ charts look visually in comparison to each other?
No one will be able to tell you exactly what to look for. That’s the beauty of what we do. It takes hard work, time, and effort to find something in the market that you think is exploitable over and over again. That’s what we call an edge.
That being said, your edge may change depending on the market. But your goal in trading simulation is to discover the strategy, then add to it.
Simulation Best Practice #4: Trade Execution Refinement
This occurs after you have found your setup. Similar to review, this is actually a specific element of review.
The more granular you become in your backtesting, the more confident you will become. Most retail traders simply have no clue what they aren’t seeing. They take another trader’s advice and run with it.
You, on the other hand, if you’re diligent, will know what triggers your entry, what rules you need to follow, when you will need to stop, and more. It is a more complete picture of the trading process.
Think about it this way:
The best professional performers on any stage often know multiple layers of “what ifs” before they perform. What if I lose my lines on stage? Could the patient’s blood pressure drop during surgery. What if the defense moves in this direction before I snap the ball? Could the enemy surprise us from this location, or that location?
You get the idea. You’ve either been there and done that before you’re actually “there,” or you’ll be surprised. It’s no different with trading.
Trading Simulation gives you the confidence in a safe training environment to study all the variables and nuances of what could happen.
Refinement Criteria to Look for in a Trading Simulator
Here are a handful of examples of what a simulator can help you with in regard to refining your trade process:
Entry trigger/criteria based on volume/price/indicator/condition
An area to define risk (setting your stop out)
Rules for trade management
When to add to a winning trade
Profit Targets
Exit criteria
Larger time frame points of support/resistance
Influence of news, sector, or fundamentals
Caveats to your rules
Anomalies
As you can see, there is more to just finding a pattern and going long or short. You need to paint the picture in your mind of all the different characteristics of what could go wrong. You need to be prepared for anything. At the same time, you must have a vision for what the trade should look like.
This takes time. Trading simulation shortens that time.
Conclusion
We hope you find this information useful. In order to help you along your journey, we’ve created tons of free educational information on different types of patterns, indicators, and strategies. If you’re new or considering TradingSim, we offer a 7-day risk free trial.
Maybe it’s time you get in the Sim and find your edge?
![Level 2 Quotes – How to Read Market Depth Chart [Videos]](https://app.tradingsim.com/wp-content/uploads/2022/03/image-21.png)