How to Find the Most Active Stocks to Day Trade + Free Video Tutorials!

Finding the Most Active Stocks to Day Trade [Video]


There are thousands of stocks you can trade on any given day. For that reason, picking the most active stocks each day can help you narrow your universe of ideas.

The potential number of trade opportunities can feel overwhelming to the untrained eye. For example, do you pick popular stocks like Apple or Google to trade? Or, do you just play IPOs and shoot for a quick flip based on the hype? All of these questions have to be fleshed out as a part of your daily trading plan.

Each day, it should be your goal of scanning the market for the best “stock movers today.” Your goal is not only finding stocks that best fit your trading methodology, but which are also the biggest market movers. The task is not as simple as just having a list of high volume stocks that you can trade every day and make boatloads of money.

Learning how to find the best stocks to day trade requires work and quite a bit of research on your part. In this article, we’ll illustrate 7 tips and tricks you can use to find the most active stocks to day trade, the biggest pre market movers, and the highest volume stock each day.

Best Stocks to Day Trade

Start Your Day Early Searching Pre-Market Gainers

Regardless of which approach best fits your day trading style, the one thing required for each selection process is that you must get an early start to the trading day.

Gone are the days where you can arrive at 9:15 am, log on to your broker, and start placing trades. The market is getting faster and faster with the increased trading volume from hedge funds.  At a minimum, you should start your prep work at 8 am market time.

This will provide you enough time to conduct your morning research and configure your monitors with the stocks you are actively tracking for the day. As part of this process, you will want to pay close attention to the pre-market gainers that are populating your scans. These are usually the best day trading stocks.

#1   Find the Best Stocks to Day Trade with Biggest Pre-market Movers

For those of you that have been trading for some period of time, you will know that the pre-market is one of the street’s favorite ways to take advantage of you.[1] A stock could be up 6% in the pre-market only to open up 2% at 9:30 am. The reason for the large price swing is due to the thin volume that can carry a stock in either direction outside of the regular trading session.

We recommend starting your scans around 8:00 am sharp, well before the opening bell.  This gives you a full hour and a half before the market opens to conduct your research. Along those lines, here is a list of what you want to look for when scanning for the best stock movers “today”.

  • Stocks gapping at least 2-5%. The gap needs to be healthy. However, since 2020 and the pandemic, pre-market stock movers are gapping higher and higher
  • Volume needs to be somewhat heavy.  If you see a stock up 20% on 200 shares, then look the other way. Ideally, Relative Volume should be well over 100%
  • Once you see a stock that is up on decent volume, you’ll want to check the news and whether or not there is any dilution risk.
  • Make sure you review the broader value of the futures market for the major indices (Dow, NASDAQ and S&P).  While breakouts can move independently of the market, it’s always a good idea to go in the direction of the broad market.

Setting Up Your Scans for Today’s Biggest Premarket Movers

Your trading platform should provide you with the pre-market movers; however, if the scans are not thorough enough, below is a list of resources:

  1. NASDAQ pre-market values
  2. Stock Market Analysis – list the pre-market movers every morning
  3. Stock Market Watch – provides top gainers and losers but also displays the pre-market value of the major indices.

There are other high powered scanners out there, but to be honest, all you really need is a method to see the top gainers and losers. However, here at TradingSim, we offer a simplified scan filtering engine that will help empower your training experience. There’s no better way to get your feet wet finding the biggest premarket stock movers.

TradingSim Scanner Tutorial

The constant need for more information throughout the day will likely lead to overtrading or too much confidence.

Not to mention, some of these scanners can get pretty costly. You need to prove you are able to make money with the most basic of scans before scaling up to the pricier options.

Examples of these pricier scanning options are Trade Ideas and Finviz. What these sites lack in design they more than make up for in their ability to provide you with more scans than you can ever dream of needing.

Choosing the Best Penny Stocks to Trade?

Now that we have covered the more conservative point of view for pre-market trading, let’s delve into the wilder side of trading – low float stocks.

Low float stocks are not for everyone as the price moves are significant. [2] These low float stocks are likely penny stocks that trade under $5 dollars. Since the covid crash of 2020, these penny stocks have become much more popular and liquid. Some of them may reach into the 100s of millions of shares traded. However, they can be risky.

Please note, if you go down this path, do not use more than 5% or 10% of your bankroll on each trade. This is more of a game where you play the pop, but you are not making a long-term investment. Odds are that these stocks are priced cheaply for a reason and will eventually drop quickly.

For an example, check out our article on the 1-3pm Bloodbath Setup. It’s a great way to play penny stock movers to the short side.

Find a Clean Pattern with the Highest Volume Stocks Pre-Market

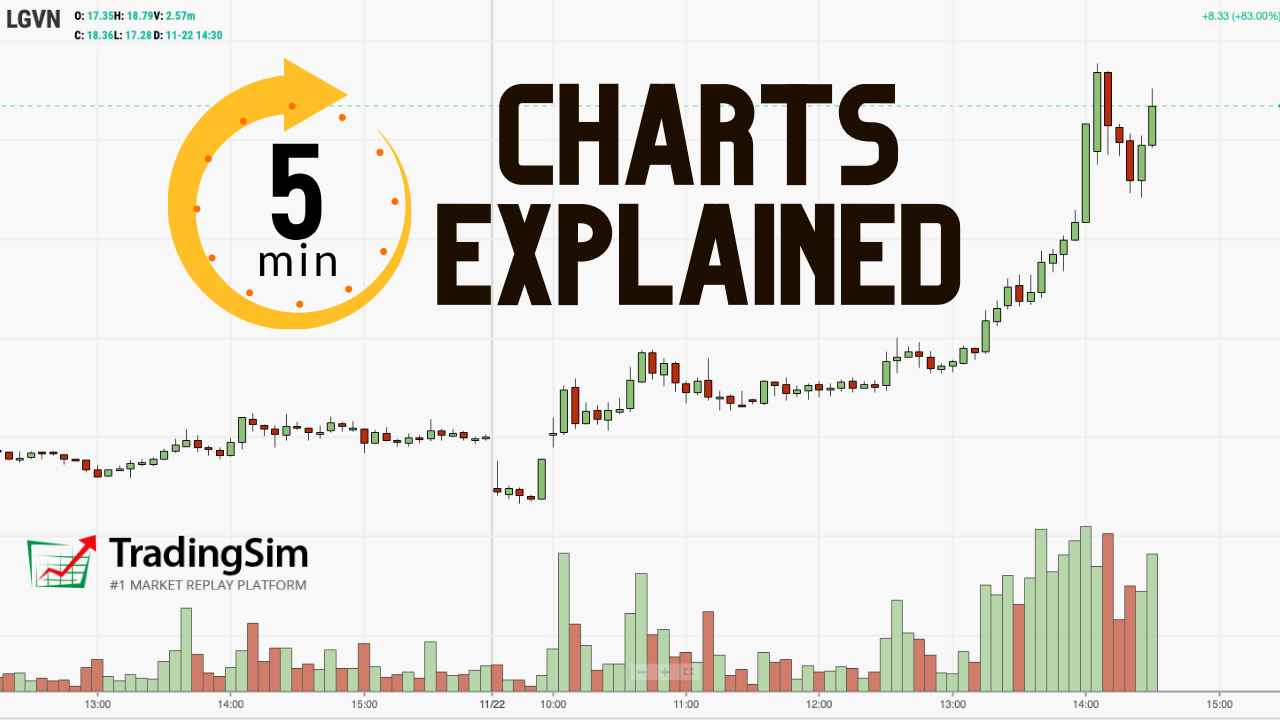
As we mentioned earlier, you want to avoid charts that have low volume in the morning. How do you know you are dealing with a chart with low volume? Just check out the image below.

Thin Volume
Thin Volume

Basically, if you feel like you are looking at stars in the midnight sky, the volume is too thin. When we say stars, we’re not talking about candlesticks – we mean literal dashes on the charts.

The pattern you trade is solely up to you. Some of you may like ascending triangles, while others may look for red to green setups (meaning the stock starts lower but later exceeds the morning highs).

Scanning for the Biggest High Float Market Movers Each Day

If you’re not interested in low float penny stocks, you’ll want to find the highest volume stocks with high float. Why high float?

These are the stocks that can safeguard your investment with a more certain move in the morning.

On average, you’ll find between 2 and 5 stocks that have both the volume and the necessary float requirements to be a real market mover.

The key for you is only trading one or two of these setups per day.

Running your scans, you should see a list of stocks like the one below:

Pre-market Movers
Pre Market Movers

As you can see, there are a few stocks on both the long and short side that are likely good candidates for an opening range breakout or breakdown trade.

Now that we have covered pre-market movers at length, let’s shift our focus back to other ways of identifying great day trading opportunities using the most active stocks of the day.

#2 Finding the Highest Volume Stocks Today

Assuming you have hundreds of thousands of dollars at your disposal you will need a stock with enough volume to allow you to quickly enter and exit the trade with ease. Everyone’s criteria may differ, but our personal minimum is about 40,000 shares per 5-minute bar.

This, of course, depends on the price of the stock and the float. Perhaps you don’t have a large account. If not, be sure to check out our small account strategy.

If you have a brokerage account, your respective firm should have a most active stocks list. This is a good place to start, but will only contain the top 20 or so stocks. You’ll need a scan that is a little broader and provides you with trading opportunities that are not being tracked by every investor. You may want to also find stocks that are rising on high volume relative to their average volume.

For example, if a stock normally trades 2 million shares a day but has 5 million shares traded before 10am, this is something of note. You may be saying to yourself, well these will show up in the most popular stocks in my trading platform. Unfortunately, this is not always the case. Again, your brokerage platform may only return a maximum number of stocks (i.e. top 10, 20).

If your trading platform does not provide you with a robust screener for the highest volume stocks, below are some great resources:

  1. Unusual Volume provided by Yahoo Finance. [3]
  2. Bar Chart provides a list of over 200 symbols [4]
  3. The Street provides not only the high volume stocks but also has a scan for stocks trading under $5 for all you penny stock lovers out there [5]

#3 Develop your Own Watchlist for Daily Market Movers

You will need to develop your own list from stocks you follow on a daily basis.  Again, due to a large number of stocks on the exchanges, it’s best to focus on specific sectors.  Below is a list of popular ones:

  • Banking
  • Precious Metals
  • Semiconductor
  • Automotive
  • Pharmaceuticals
  • Retail
  • Internet

Once you have one or two sectors you would like to follow, begin to track the movement of the top issues. Give yourself a few months of consistently watching the stocks and the sectors in terms of their price movements.

As a follower of the Richard Wyckoff method, you’ll learn that each sector and stock will have an ‘operator’ that is in control of the market action. This operator is the collective investors or market makers with the most money in the stock; therefore, they have a controlling interest. 

Using Gold as an Example

Let’s take an example from the ’08 market.

Every day like clockwork stocks Royal Gold (RGLD) and Golden Star Resources (GSS) would have sharp reversals at 10 AM.  A system of buying or selling short on breakouts of the morning’s trading range would fail consistently with these precious metal stocks.

While experience would’ve taught you to avoid this particular sector for 6 months, you could use the watch and learn approach to understand how a particular market moves in order to gain an edge over other traders.

The one challenge with building a list is limiting the number of stocks you watch within 1 or 2 sectors down to the biggest market movers. You are manually tracking these stocks and building a sense of touch for how they trade. At most, you should only track 10 stocks per sector, so this gives you a maximum of 20 stocks you can follow at any one point.

This should give you a feel for not only the stocks in the sector, but if they are real stock movers, and whether or not they fit your strategy.

#4 Keep Up with Historical Market Movers

Instead of looking to someone else for advice on what the best stocks to day trade are, how about looking at your own trade performance. There is at least one stock you trade on a regular basis for one reason or another.

Funny thing is you will not be able to explain why you keep gravitating to that particular security. Call it your soul mate or just your stock of choice. Your comfort level with the stock will make you feel like you “own” its movements.

You can move in and out of the stock with ease and generally make a profitable trade on each attempt.

For me, I couldn’t get enough of Baidu Incorporated (BIDU).  For all of you fans of the show Scandal, she was my Olivia.  I would track BIDU every day even if she wasn’t moving much.  For some reason, I was able to predict her movements and never found myself fighting the trade.

So, look back over your trade history. Is there one stock market mover that keeps popping up on your list of trades?

#5 Social Media Stock Movers and Pumpers

This is a more recent technique for scanning the market. It can be a bit tricky, however. The reason for this is that searching social media sites or reading news events might positively or negatively impact your view on a stock.  

We recommend basing your trade decisions solely on the price and volume action of the stock. That being said, there may be some underlying sentiment on social media that is worth knowing.

Play StockTwits

StockTwits streams the hopes and random thoughts of investors for many securities.  They even have a market sentiment factor which displays at the top of each wall for the respective stock.  

In terms of which stocks most active stocks to day trade, if you visit the homepage you will see a list of stocks across the top which are trending.

These are stocks that members are actively discussing as Stocktwits plays. You will quickly notice that these are the stocks in the news. Nonetheless, there are times when members are discussing a move in a stock during the middle of the day before a news publication is able to produce an article.

Play Stocktwits for most active stocks

The best method for using StockTwits without a doubt goes back to the list of pre-market movers. You can, of course, look at the news event which is pushing the stock higher or read the latest press release from the company, but StockTwits allows you to get a real pulse of the market.

You can actually use StockTwits as a method to validate exactly how much interest there is in the stock.

If you see a stock up 10% but with only two tweets, it’s likely not in play.

However, if you can find the stock that is up on heavy volume and the board for the respective security on StockTwits is very active, you likely have a stock in play.

Remember, it’s not about the level of bullishness or bearishness on the board – all you care about is if people are talking about the stock you have an eye on.

Similar to StockTwits but with a twist, is the popular sentiment lists being viewed on swaggystocks.com. Swaggystocks essentially crawls many of the popular social media outlets like Twitter, WallStreetBets, Reddit, and more. They compile the most mentioned stocks into cute little charts that tell you what’s trending.

swaggystocks.com social media sentiment indicator for most active stocks
swaggystocks.com social media sentiment lists

The cool thing about swaggystocks.com is that they offer many different social sentiment lists that are updated frequently throughout the day. What this can do for the retail trader is give insight into what stocks are most active. You might find a potential market mover or high volume stock from this list.

Of course, as with any stock in play, you want to have a setup and a trade plan. Don’t be a bag holder just because AMC is being mentioned a lot on Twitter. Stick to your edge.

TradingSim Historical Market Movers Scanner

TradingSim’s market movers scan provides a list of the top 50 losers and gainers for every session in the market going back 3 years. For most brokers, they don’t keep track of this data. To that end, you’ll have a tough time identifying which stocks were trending on a given day in the past.

TradingSim Market Movers Pane

Market movers inside TradingSim will allow you to pick a random day 6 months in the past and actually see what the most active stocks were for that day. Just as you would research and track the hot stocks for each morning, market movers automatically provides this function for you on historical days. This way, you can just focus on practicing day trading.

#6 Monitor the Earnings Calendar for Potential Active Stocks

One event that is sure to bring about increased volatility is the reporting of earnings. This occurs quarterly throughout the year.

Be sure to keep track of who is on deck for the week. That way, you can start to monitor how the stock is trading going into the earnings announcement.

To be clear, we are NOT advocating you place a trade before the earnings are reported, because this is another form of gambling. You will, however, want to know who are the upcoming market movers and most active stocks for that day, so you can add them to your watch list.  

This will reduce the amount of research required prior to the market open.  Below is a list of sites that publish earnings calendars:

#7 Focus on One or Two Stocks from Your Most Active Stocks List

Focusing on one or two securities is all about keeping it simple.  In all of the above examples, you would need to scan, watch, and react quickly on a daily basis to a large number of issues.

If this is something that you feel is too much and you want to become a master of something simple, then look to trade the same one or two issues every day. Or, at a miminum, choose only a few of the highest volume gainers or most active stocks each day. 

Selecting a Stock to Trade from Your Most Active Stocks List

When selecting a stock to trade, you have two approaches: (1) select the most popular stock or (2) pick your favorite stock based on your past trading performance.  #2 will largely depend on your own trading preferences, so we’ll cover a few top stocks for day trading:

  • AAPL (Apple) – high volume and great price action.  The popularity of the company has transferred over to the stock’s popularity in the trading community
  • S&P 500 Spiders (SPY) – While this is not a stock but an ETF that follows the S&P index, the volume is huge and provides the means for you to trade the index without trading futures
  • QQQ – formerly known as the QQQQ has been a fan favorite of active traders for over a decade
  • TSLA (Tesla Motors, Inc.) – if you like volatility, the stock moves as fast as its cars
  • NFLX (Netflix) – the CEO is willing to make bold decisions, this has translated into significant price swings in the stock
  • FB (Facebook) – there are few stocks that have polarized traders as much as Facebook

It’s safe to say we are a little biased towards the NASDAQ when it comes to day trading.  The NASDAQ’s ability in the late 90’s to facilitate order flow has forever stamped them as the preferred index for active traders. You’ll typically never fall short of a daily market mover or high volume stock on the NASDAQ.

Below are the benefits of trading one or two stocks:

  • Learn the trading pattern and personality of the stock
  • Identify the technical indicators best suited for the security
  • Less stress
  • Less work to do before and after the market close

In Summary

There are multiple ways to select the best stocks for you to day trade.  Remember, trading is a journey, so don’t try to figure it all out in one day.  Just make sure your scan provides you the means to trade high volume stocks with a sound system that consistently makes you money.

If you do decide to create custom scans, you will want to focus on the following key areas:

  • high volume stocks
  • gappers
  • pre-market movers
  • red to green and green to red moves
  • consecutive number of red or green candles
  • biggest stock gainers and losers

Results for these 6 scans will provide you more than enough as a new trader.

We hope you found this article to be helpful in your quest to find the most active stocks to day trade.  If you would like to see how we can help you further, come over to Tradingsim.com and give our market movers a shot. We’re sure you’ll find our top stock mover tips useful.  

Here’s to good fills!


Photo Sources

Stock Ticker – francisco.j.gonzalez

External References

  1. Cramer, Jim. (2019). Don’t Mess Around with Pre-Market Trading During Earnings Season. CNBC
  2. Low Float Stocks. lowfloat.com
  3. Most Active Stocks. yahoo.com
  4. All US Exchanges Volume Leaders. barchart.com
  5. Most Actives. thestreet.com

So you want to be a day trader? You want to make that fast money? We get it. Who wouldn’t, right? Well, before you jump in head first and start pushing buttons, give us a bit of your time to discuss everything you need to know, first, in this beginner’s guide to day trading.

Day Trading 101

The Lure of Day Trading for Beginners

Success theatre has made a big impact on the lure of the average Joe into day trading in recent years. The constant barrage of juicy wins being shared on Twitter and YouTube these days make it sooo tantalizing. After all, if Jimmy Guru could go from barista to baron in just a few short months, surely he can teach you how to as well?

All kudos to Jimmy Guru, but the reality of day trading is that it’s very difficult to reach a high level of success. It’s then even harder to maintain that level of success

Nonetheless, we are in the business of helping traders reach that success, so don’t get the wrong picture. We believe it is attainable. And, for the right person, we believe it is worthwhile.

That being said, our goal in this beginner’s guide to day trading is to paint a realistic picture for you, rather than the pomp and glamour you’ve been exposed to. Along the way, we’ll give you some valuable insights into what to expect, what you should know, and what you should avoid.

What Is Day Trading?

Day trading is simply the buying and selling of a security, asset, or commodity in the same day. Holding positions overnight is what we call swing trading, and that’s a whole other discussion.

Simply put, if you open a trade in the market, then you close it the same day, you’ve made a “day” trade.

This can apply to stocks, currencies (forex), futures, crypto, or anything else that’s tradable on the markets. It doesn’t really matter. 

How Much Do Day Traders Make?

This is a bit difficult to say. Honestly, most day traders don’t make money…they lose money. However, professional traders, we have written a great article that outlines a typical day traders salary here.

Online, you’ll be quick to find many YouTube videos and gurus who’ve made millions. Their results are not typical, and can be difficult to replicate. In fact, many of these gurus are suspect regarding their trading practices, knowing they have so many followers who may buy a stock based simply upon their recommendation.

All in all, a great way to think about this is to see how little you need to make each day in order to meet your financial needs. Here is a great tweet from a market veteran on how little it takes to make a living, if you’re consistent:

Along those lines, we don’t recommend focusing on how much you can make, but on your process. We’ve done a few great interviews with guys who’ve gone from $1500 to almost a million in a short time. Be sure to check those out on the SimCast!

What Does It Cost To Day Trade?

Aside from the risks of losing money, you can day trade nowadays for practically free. Most brokers will offer free trading. However, not all brokers are created equally.

If you’re planning on day trading with precision and larger share size, you will eventually want a quality platform.

The drawbacks to having a quality platform, which doesn’t sell your order flow, is that you will pay commissions and fees.

There are a few different ways that this can be calculated depending on the broker:

Per-Trade Commissions in Day Trading

Per-trade commissions are usually calculated for low volume traders. Typically, the per-trade commission standard is around $5-$7 dollars per trade.

So, think about it this way. If you place 20 trades in a single day, you’ve racked up around $50 or so in commissions. 

Obviously, for small accounts, this can add up quickly. For that reason, you want to either limit the amount of trades you make, or have enough starting capital to support these costs.

Per-Share Commissions in Day Trading

Usually, the per-share commission structure is applied to traders with larger accounts and higher frequency trades. The rate can be as low as $0.002 per share. Most brokerages will have a tier system depending on the amount of shares you trade. 

The more you trade, the lower your per share commission size, typically. As you can see from doing simple math, it would take 1000 shares to add up to a $2 commission.

In addition to commissions, there are ECN fees, and other items to consider. Once you become more proficient at trading, you can even get rebates depending on how you route your orders.

Why Day Trading Is Attractive

Unlike swing trading or long-term investing, day trading can provide opportunities to make high percentage gains in a very short amount of time. 

Think about it this way. If a stock has the ability to move 20% in a single day, would you like to capitalize on that opportunity? Or, would you rather wait days, weeks, or even months for a stock to reach 20% in gains? 

Therein lies the temptation.

Everyday in the market, there is usually an opportunity for a stock to make a big move. Seasoned day traders know how to anticipate these moves based upon volatility and momentum. Add some amount of leverage (margin) into the mix and you have a recipe to either increase your account exponentially in a short time, or lose it all.

Sounds a lot like gambling doesn’t it? Well, we’ll discuss that next.

Is Day Trading Gambling?

In short, it all depends. Day trading, or any other trading for that matter, when done properly, is a game of probabilities. Most new traders don’t understand this, no matter how many times you tell them.

To new traders who are itching to make millions — the faster you can get there, the better. Unfortunately, this leads to gambling. 

Irresponsible gambling is throwing a bet on something with no idea what your outcomes may be for success. Your “odds,” so-to-speak. When you don’t know your odds, you’re at the mercy of happenstance. Who knows where the chips may fall, right?

So it is with trading. If you trust a guru with your money to tell you what is going to work and what isn’t, how did that guru earn your trust? Did he/she provide the probabilities of a successful outcome with you? 

If not, what are you trusting in? 

Likewise, if you take a trade based on a hunch, or “to see what happens,” you’re essentially gambling. You might as well be in Vegas.

Gambling vs Probable Outcomes

The difference between blindly gambling and successful trading comes through a deep understanding of your probable outcomes. Using the example above, if we throw a bet on something we know has a 75% chance of success, we are no longer gambling. 

The trick is figuring out what variables and patterns play out in the markets, time and again, in order to find these outcomes. Once you do, you are armed with an edge – a strategy. The rest is simply monitoring your position size and growing your account over time by keeping your risk in tact.

Discovering Your Edge Before You Start Day Trading

To avoid gambling your hard-earned money or life savings away, this may be the most important aspect of your budding career in trading — discovering your edge

Lessons from Jesse Livermore

There is a famous trader that you may or may not have heard of by now named Jesse Livermore. In a book that profiles his life, he says the following:

“The game taught me the game.”

The Life & Death of Jesse Lauriston Livermore - Beyond Debt
Bucket Shops – Photo taken from The Life & Death of Jesse Lauriston Livermore – Beyond Debt

Livermore grew up working in what were called bucket shops. They were local trading rooms where you could place bets on the market. Back then you were basically all in. Every trade was all or nothing.

Having worked there for so long, Livermore began to see patterns play out in the prices of stocks as they were printed on the “tape.” Before long, he began betting on these patterns, and winning handsomely.

Observe Before You Bet, Look Before You Leap

The reason we mention that story is twofold:

  1. If you spend enough time observing the markets, you’ll discover an exploitable pattern that can make you a handsome living.
  2. Skip this integral part of your journey, and you’ll spend a lot of long, hard years suffering set back after set back.

Observation and discovery are the keys to your success. We believe it so much that we created a niche market discovery tool that allows you to replay the entire market for up to three years.

Ponder this for a moment: 

Let’s assume you’re a soldier and you have a mission to accomplish. Would you rather jump out of an airplane into enemy territory with no prior knowledge of the terrain, the enemy, the target, the climate, or the language; or, would you rather train for a few months on what the enemy looks like, the compound where he may be hiding, how many guards he has, the terrain you’ll have to traverse, the language of the people, etc.?

In which scenario will you be more successful? Which one is more of a gamble?

Day trading is not a safe market for an uneducated trader to put his money. It’s dangerous. Literally speaking, 94% of traders lose money in the market over time. Let that sink in. 

How to Find a Strategy for Day Trading

All that being said, there are a few ways to go about discovering an edge for day trading. Like we just mentioned, you can observe enough market action until you see a repeatable pattern. Conversely, you can study a guru who has published his/her own strategies.

We are big proponents of as much original observation as possible. However, we also believe that the learning curve can be drastically reduced through quality and trustworthy education, like good podcasts for example!

In the end, though, your “edge” needs to be yours, no matter what bits and pieces you learn from here or there.

3 steps to find your edge as a beginning day trader

Step 1 for Discovering Your Edge in Day Trading: Patterns

Look for cookie-cutter patterns. You know, the flags, the wedges, the pennants, the cups with handles, the head and shoulders, the abcds, etc. Maybe you want to trade with the trend, perhaps you find reversals are more lucrative. 

You should also study candlestick patterns. We have a great guide for these.

Regardless of the pattern, the same ones that have been documented for years and years still play out in the market every single day.

Along these lines, start observing the biggest moves in the shortest amount of time. What happens when stocks gap up or down on large volume? Can you find predictable volatility in order to exploit a large intraday move based on what you find?

At the end of the day, the goal of a day trader is to make the most amount of money in the shortest amount of time, all while managing risk. In order to do this, you must find the largest, yet most predictable, price swings intraday. That’s it. 

Find enough of these, and you’re well on your way. We’ll discuss a few strategies in a moment.

Step 2 for Discovering Your Edge in Day Trading: Picking a Side

Once you find a pattern, pick a side. In the beginning, it will help you focus by choosing the long side or the short side. The goal here is to become consistent. It doesn’t mean you’ll stay a bull forever, or a bear forever. 

To a beginning trader, flipping your position here and there and then back again can be utterly confusing and confounding. Therefore, pick a side. If you see a pattern of low priced stocks gapping up and then failing, maybe shorting is better for you.

To the contrary, if you’re a more optimistic personality, perhaps you like the long side. Either way, it’s best to pick a side in the beginning, then study it until you’ve mastered it. You can always add strategies further down the road.

To that point, pick a side that fits your personality.

Step 3 for Discovering Your Edge in Day Trading: Backtesting/Outcome Testing

Like we said earlier, you’re only as good as your known probable outcomes in the market. 

As the late Mark Douglas once said, “anything can happen” in the market. Day trading is often risky and is never certain. There is no edge that will have a 100% win rate, ever. If there were, we’d all be rich.

Understand that losses will be a part of your experience more often than not. Unless you can embrace this, your odds for success are slim. It all boils down to testing your outcome for a specific strategy.

For example, if you know that stocks with a float size of less than 20 million that gap X% on Y million shares of volume have a Z chance of breaking down after 10am in the market and will close lower than they opened on the day 70% of the time, then you can place your bet knowing your probable outcomes. 

30% of the time you’ll be wrong. Then it becomes a matter of managing your position size each time.

This is just one example, but there are myriad examples like this. The bottom line: test the pattern you see with as much data as you can and with as many examples as you can.

Then, narrow down your criteria for entry, rules for trade management, and criteria for exiting the trade.

This is where true confidence comes from in trading. Don’t take our word for it, take Qullamaggie’s word for it.

The Importance of Simulation and Paper Trading

Paper Trading Apps for Day Traders

Simulation plays a huge role in day trading, mainly because it allows you to backtest and outcome test much faster. Trading live each day will take you many years to accumulate the amount of chart/screen time necessary to build pattern recognition in your mind.

Not only do you want to rely on your data, but you also want to rely on your “chart eye.” Your chart eye becomes a necessary component to your trading, unless you are a systematic/algorithmic trader.

Most traders are not algos. They are discretionary. However, as discretionary as many traders may seem, the repertoire of patterns they have become accustomed to essentially becomes systematic. 

You learn what qualities you need to see in volume and price action before you put on a trade, for example.

With paper trading, time is condensed. You can trade whenever you want, testing as many strategies as you want, on as many tickers as you want. And if the platform is complete, you’ll be able to track your strategies in an analytics page, like we provide here at TradingSim.

Don’t listen to the naysayers who will tell you that paper trading doesn’t prepare you emotionally for the real environment. The most successful traders in the world will tell you differently. We’ve already debunked this myth with the most prolific trading psychologist in the world.

It’s all about discovering your probabilities. That is what builds confidence.

The Pattern Day Trading Rule and What It Means for You

Pattern Day Trading Rule

When getting started in day trading, a lot of your success may actually depend upon whether or not you’re affected by the Pattern Day Trading rule (PDT). This rule limits the amount of day trades you can make in a week if your account is below $25,000. 

On a margin account, you’re only allowed 3 day trades in a 5 day period. So, if you make 3 day trades in one day, you’ll have to wait 5 days to make another.

We discuss ways around this and the potential for international brokerages to free up your available trades, but you need to understand how this can affect your performance.

  1. You’ll be more inclined to hold losing trades because you won’t want to burn a day trade.
  2. Unless your strategies are built on high win rate and high profitability ratios, it may take you a looooong time to get over PDT.
  3. If you can find access to a brokerage that allows you trade freely, you’ll have to exercise discipline to overcome the “over trading” habit.

As you can see, there are quite a few caveats here, but at the end of the day your success will revolve around two things:

  • Your ability to trust your edge/strategy
  • The ability to stay disciplined enough to only trade your edge

That being said, whether you’re affected by the PDT rule or not, the goal is the same. Only trade the highest quality setups that you’ve tested well enough to trust. 

Lastly, if you place more than 4 day trades in a 5 day period, know that you will be flagged as PDT. If you don’t top up your account, you’ll have to wait 90 days, or apply for a waiver in order to trade again.

How Much Money Should You Start Day Trading with?

This is a tricky question. On the one hand, if you are above the PDT rule mentioned above, you should have plenty of money to make a good living at this. If you are under PDT, you’ll likely need more time. 

At the end of the day, it doesn’t really matter how much money you start with. In fact, we recommend starting small if you can. If you’re above PDT (above $25,000 in your account), then you may be prone to trade with large size.

Likewise, if you have an international broker, you might be able to start with only $5000, but not be affected by the PDT rule. Fees and commissions aside, we like to say that if you can’t make it with $5k or $25k, you won’t be able to make it with $100k. 

Granted, the amount you have to trade with may influence the types of stocks you trade. Larger accounts can capitalize on the slower moves of larger stocks and still make good money. Whereas smaller accounts can get in and out of smaller stocks that give bigger intraday gains.

Cash or Margin for Day Trading

This is a great question for beginners, especially depending upon whether or not you’re under the PDT rule. 

Cash or margin for day trading beginners

Using Margin

Using a margin account has its benefits if you want to trade more. Essentially, this allows you to trade as often as you want, granted you aren’t affected by the PDT rule. It can also give you up to 4x or even 6x leverage on your buying power.

But, before you think about this as a blessing, it can often be a curse if you don’t know what you’re doing.

Here are a few other key points for margin accounts:

  • If under PDT, only 3 day trades in 5 business days
  • Potential to lose more if on leverage
  • Can buy more shares than a cash account
  • The ability to also open a cash account

Using Cash

On the other hand, cash accounts allow you trade with your available cash only. Each trade you make will take two days, plus the day you traded, to reconcile. For this reason, you might consider having two accounts open as cash accounts.

This will allow you to place more trades.

Here are a few key points for cash accounts:

  • The ability to place more trades by using less of your cash per trade
  • Can be opened with a margin account, giving you two accounts
  • No leverage, so less risk
  • If you place a trade with unsettled funds (T+2), then you could get suspended

All in all, there are pros and cons for each. It really all boils down to how much money you have and how disciplined you are no matter what kind of accounts you open.

For more information on cash versus margin accounts, click here.

Tools of the Trade

Like any job, you will want quality tools to enable your success. While some people are able to make money simply using their phones and a Robinhood account, the best traders prefer quality tools.

Let’s look at a handful of things you’ll need to get started:

A Decent Computer

Unless you want to day trade on your phone, or by calling in orders to your broker (really old school) you’re going to need a laptop at a minimum. It can be difficult to navigate order flow on a phone, and you should be able to see charts and Level II data to make your decisions.

Many brokerages nowadays use both Windows and Mac for their platforms. That being said, Windows is much more prevalent for many brokers. You can, however, run Windows on a Mac with Bootcamp or a virtual desktop application.

That being said, if you decide to run multiple screens and chart windows, you’ll want a computer with a decent amount of power to support all of that. Consider using the most recent processors available, consult with the computer company about your plans, and you’ll find one that works for you.

Multiple Monitors

Not every trader likes to trade with multiple monitors, but as a general observation, most professional day traders do. There are plenty of options available from vertical screens, to curved gaming monitors.

Whatever you decide, just make sure you understand that more screens and more charts is not always best. Sometimes less is more.

At the end of the day, it is about what works for you. If you want to monitor multiple tickers, news sites, fundamental sites, chat rooms and more, then maybe you need more monitors. Sometimes cutting out the noise and having fewer screens can be beneficial as well.

A Brokerage Account and Charting Platform

Most brokerages provide you with a charting platform. However, some will charge you for using the platform.

There are handful of options like Sterling Trader Pro, or LightSpeed, among others. These platforms are considered high end day trading platforms that connect with multiple brokers to provide fast order execution.

Other brokers like WeBull, or ThinkorSwim, or Interactive Brokers have their own charting and order execution platforms. They offer free options as well. It will be up to you to decide which one is best for you.

Despite the plethora of brokerage platforms, many traders opt to use a secondary charting platform outside of their brokerage. The most popular platform for this is TradingView.com.

Essentially, this allows you to chart on one platform and trade on another.

Morning Scanners

In addition to a charting platform, you need to make sure that your system comes with a quality scanner. This is imperative for day traders who are looking to find high quality momentum setups intraday.

Many scanners will show you the highest % gainers or losers on the day, along with the highest volume or most active symbols. The best scanners will allow you to filter your resutls according to your strategy criteria, like float size, market cap, etc.

Here at TradingSim, we are one of the few simulators that allows you to replay the market with a live scanning engine. Here is example of some of the features in our scan filter.

TradingSim Day Trading Scanning Filter
TradingSim Scanning Filter

A Paper Trading Simulator that Allows You To Use Replay

The last tool we will mention is the ability to replay your trades. So many great educators and traders recommend recording your screens while you trade, like Nate Michaud. The reason for this is that it’s great review.

When you can replay the market, you can relive the experience and make notes on what you can do better next time. Maybe you missed something in the Level II or Time and Sales. Whatever the case may be, review is done best through replay.

Our Favorite Day Trading Strategies for Small Accounts and Beginners

Let’s be clear, you can find a million different ways to make money in day trading. There is is no right way or wrong way. Nonetheless, what is most important is that you find a strategy that you can master.

As the old adage goes, you don’t want to be a jack of all trades and a master of none. This is doubly true for the stock market.

Along those lines, here are our two favorite strategies for growing a small account, one for the long side, and one for the short side.

The Intraday Volatility Contraction Pattern

We talk about this strategy in depth in this article. It is essentially a fantastic way to keep your risk defined to a certain level while going long anticipating a breakout intraday. Typically it is more of a continuation pattern. Here are the 5 things to look for before the setup forms:

The Day Trading Volatility Contraction Pattern Criteria:Strong Underlying Demand Recent Overbought/Supply pressure Diminishing supply characteristics Decreasing volatility Explosive breakout

As part of this pattern, we borrow from the wisdom of Minervini’s Volatility Contraction Pattern and Gil Morales’s pocket pivots and vdu. Here’s a rough sketch of what this pattern looks like:

Intraday day trading volatility contraction pattern
Intraday volatility contraction pattern

For the setup you want to look for a nice momentum burst off the open, followed by a tightening or contracting in the base. As each consecutive higher low forms, it gives you an opportunity to enter long and risk to just below the prior higher lows.

To time your entry, we like to use the volume and price analysis that Gil Morales teaches. Here’s an example of what this looks like inside Tradingsim:

small account strategy with pocket pivots and vdu
NTEC VCP with VDU and Pocket Pivots

Notice that you can take the entry on the pocket pivot after anticipating a launch higher after the volume dry up.

This often leads to very large gains in relation to the risk you have. Here is what NTEC did on this particular trade:

Small account strategy with stop and gain
High reward to low risk

As you can see, this setup provides a very low risk to high reward, exactly what you want as a trader.

The 1-3pm Blood Bath Setup

We discuss this strategy in depth here.

In the world of low float, low-priced stocks, most of the momentum you see eventually fizzles. It’s true that most of these companies are not financially sound and are simply using the market as a tool to raise money.

As astute traders, it is our job to not believe the hype, but to trade the reality. on that token, the reality is that most penny stocks will pump and then dump through a means of diluting the shares.

One great way to take advantage of this is by anticipating the “dump” phase. After watching these pumps over and over again, you’ll begin to notice that many of them will clear out the long chasers and early shorts, then dump the price towards the end of the day.

Here is what the criteria looks like:

1-3pm Bloodbath criteria

One example of this occurred on ticker COCP. This symbol was a low float ticker that was up over 273% intraday. It had a high chance of dilution, and announced an offering after 1pm on the day of its big run.

Notice how the stock was trying to breakout to new intraday highs shortly after 1pm.

COCP double top at 273%

Shortly thereafter, COCP announced an offering at $1.54 per share, much lower than it was trading. It had an open shelf offering, which alert traders would have known about.

The result of the offering announcement was devastating. It lost half its value you in a matter of minutes.

COCP 1-3pm bloodbath

Clearly you can see that this didn’t workout well for breakout buyers. As a great additional resource, we recommending studying this setup through the articles found here.

Getting Started as a Beginner in Day Trading

Now that you understand many of the basics about day trading, we encourage you to proceed with caution. This is a marathon, and not a sprint. Keep your expectations low, and your effort high.

To that end, we recommend the following activities as a summary of steps to get going:

  1. Devour as much education as you can in 6 months to 1 year.
  2. Find a solid mentorship program
  3. Begin day trading in a simulator for the first year.
  4. Only put real money to work with a broker when you can prove you have a profitable system in a simulator.
  5. Tweak your system and manage your risk over time
  6. Add to your system with new strategies only once you can provide enough income for your needs.

Feel free to reach out if you need help at [email protected]. We’d love to hear your feedback!

Trading Simulation: Enlighten Your Edge

Despite what you may have been told, simulation trading can increase your chances of becoming a consistently profitable trader. It’s all dependent upon on how you use your time in the software. Here’s why.

As we’ve covered in recent articles on the top 4 simulators with replay, and the big myth behind paper trading, if you come to trading as a beginner with the attitude that simulation doesn’t correlate with real-world performance, you’re misguided. However, if you simply use simulation trading for fun, or in an undisciplined and unstructured way, you’ll likely never reach the potential you wish for. That is, not without a lot of loss and heartache and time spent.

This is the type of thing that comes with passion. Are you passionate about studying the markets and putting in the time and effort needed?

If you’re motivated to learn and master markets, you’ll enjoy simulation and playing with trading ideas.  If you’re motivated by making money and showing off pictures of your new cars on social media, simulation won’t hold much appeal. 

When surgeons learn new techniques, they practice on models and cadavers before “going live”.  If a surgeon told me he didn’t think such practice was important, I’d likely look elsewhere for my procedure….

Dr. Brett Steenbarger, PH.D.

To that end, we want to help you shorten your learning curve by discussing four best practices for simulation trading that will likely increase your chances of success.

Simulation Trading Best Practice #1: Screen Time and Exposure

There is one thing all stock educators and gurus agree upon. The amount of screen time you accumulate studying the markets will likely correlate with your understanding of trading. It might not cause success, but it will certainly help.

The more screen time the better. Don’t take our word for it, just listen to Jack Tacher in our recent podcast talk about how many 1000s of charts he reviews. Well, we couldn’t agree more. But the problem is that there are only certain hours of the day in which you can trade markets. The New York Stock Exchange opens at 9:30am and closes at 4pm.

What if you are getting into trading part-time? Can you really put in the focus you need when your boss isn’t watching your cubicle? It’s hard to place trades while waiting tables, building a house, or meeting with clients.

Simulation Trading Is Available On Your Schedule

While not all simulators will allow you to trade in a realistic market environment outside of normal trading hours, TradingSim, does. We’ve also reviewed a handful of other simulators with replay here. The benefit of these applications is that you can essentially push play, like a DVR, and study the markets in the evening, the weekends, or whenever you want.

Regardless of whether or not you can trade the open, it allows you even more screen time. Perhaps you didn’t see certain stocks that ran during the day. After all, you only have so many screens and so many eyes. But the market has 1000s of stocks.

Simulation trading allows you to go back and see what you missed with the intention of finding these opportunities better in real time.

This leads us to our next point: the importance of review.

Simulation Trading Best Practice #2: The Importance of Review

If screen time is a prerequisite for success, then review has to take the #2 spot. It’s imperative. How else will you know where you went wrong?

Reviewing trades and performance reveals so many underlying issues with our trading that are simply overlooked in the heat of the moment.

Dr. Brett Steenbarger has this to say about reviewing trades:

Good reviews give you fresh views.  Good reviews help you see new things in the markets you trade and in how you’re trading them.  If reviews aren’t providing you with insights, they probably aren’t providing you with learning.

Dr. Brett Steenbarger Ph.d.

Along those lines, one of the best ways to review is to get into the simulator and replay the market. Replay your trades. Relive the experience. Observe what’s going on around you in an effort to discover insights and new ideas. Watch the Level 2, Time and Sales, or other key elements of the trade to find patterns and key areas.

How to Use the Simulator for Review

According to Steenbarger, there are three things you should be aware of when reviewing trades.

  1. Don’t review too much
  2. Create actionable insights
  3. Revisit your goals and takeaways

This sounds really simple. However, many traders create information overload by observing and reviewing waaaay too much data. As we will touch on in a moment, the goal of the sim is to boost your confidence in a strategy. For that reason, be focused in a specific area of the market.

Good review doesn’t really do much for you if you don’t takeaway insight from that review. Watch your trades in replay, study the Level 2, but make notes about certain things you see. Was there a large order being pulled before the flush? How did volume react at certain levels or certain times? Make notes for your next trades.

Lastly, keep your notes and your progress handy. The point of goals is to achieve them. But without incremental steps and a solid process, goals become elusive. Remind yourself to check in with your progress on the action items you create from reviewing.

Simulation Trading Best Practice #3: Backtesting Patterns in the Market

This best practice is an extension of the first two. You’re not going to discover a pattern overnight. Sure, your guru may have found a pattern, but how do you know it works? Did you see her excel spreadsheets? And more importantly, how did she find that pattern?

The bigger question, if you have some sort of pattern in mind (and there are many…), is how you will know the probability of its success. What makes that pattern work? What makes it fail. Herein comes the need for a simulator.

As successful traders like StockBee and Qullamaggie have written, a simulator allows you to see 100s, if not 1000s of patterns in the market. In other words, backtesting. On that token, we’ve written an article about how to find a setup of your own. We’ll share a few tidbits from that article.

Things to Consider When Backtesting Your Strategy in Trading Simulation:

  • Is your personality suited for the long or short side of trading?
  • Do you like swing trading or shorter term daytrading?
  • What patterns do you see on your charts? Gap and go? Gap and fail? Mean reversion?
  • What is the float, market cap, price, and average volume of the biggest winners?
  • If day trading, what time of day does your setup work best? Worst?
  • Does volume predict anything in your setup? Compared to float?
  • What about short % of float should you consider?
  • Do fundamentals like potential offerings or dilution have any affect on your strategy?
  • What do you observe in the tape intraday during the pattern you have observed?
  • How do your successful trades’ charts look visually in comparison to each other?

No one will be able to tell you exactly what to look for. That’s the beauty of what we do. It takes hard work, time, and effort to find something in the market that you think is exploitable over and over again. That’s what we call an edge.

That being said, your edge may change depending on the market. But your goal in trading simulation is to discover the strategy, then add to it.

Simulation Best Practice #4: Trade Execution Refinement

This occurs after you have found your setup. Similar to review, this is actually a specific element of review.

The more granular you become in your backtesting, the more confident you will become. Most retail traders simply have no clue what they aren’t seeing. They take another trader’s advice and run with it.

You, on the other hand, if you’re diligent, will know what triggers your entry, what rules you need to follow, when you will need to stop, and more. It is a more complete picture of the trading process.

Think about it this way:

The best professional performers on any stage often know multiple layers of “what ifs” before they perform. What if I lose my lines on stage? Could the patient’s blood pressure drop during surgery. What if the defense moves in this direction before I snap the ball? Could the enemy surprise us from this location, or that location?

You get the idea. You’ve either been there and done that before you’re actually “there,” or you’ll be surprised. It’s no different with trading.

Trading Simulation gives you the confidence in a safe training environment to study all the variables and nuances of what could happen.

Refinement Criteria to Look for in a Trading Simulator

Here are a handful of examples of what a simulator can help you with in regard to refining your trade process:

  • Entry trigger/criteria based on volume/price/indicator/condition
  • An area to define risk (setting your stop out)
  • Rules for trade management
  • When to add to a winning trade
  • Profit Targets
  • Exit criteria
  • Larger time frame points of support/resistance
  • Influence of news, sector, or fundamentals
  • Caveats to your rules
  • Anomalies
sharpen your trading skills with trading simulation

As you can see, there is more to just finding a pattern and going long or short. You need to paint the picture in your mind of all the different characteristics of what could go wrong. You need to be prepared for anything. At the same time, you must have a vision for what the trade should look like.

This takes time. Trading simulation shortens that time.

Conclusion

We hope you find this information useful. In order to help you along your journey, we’ve created tons of free educational information on different types of patterns, indicators, and strategies. If you’re new or considering TradingSim, we offer a 7-day risk free trial.

Maybe it’s time you get in the Sim and find your edge?

If you’ve ever traded in stocks or crypto, you’ve more than likely heard the term “bag holder.” Veterans in the market understand the term very well, for reasons we’ll point out in this post. So, if you are just starting out in trading, please take the time to read through this. It may save you a lot of money and a lot of heartache.

What does the term bag holder actually mean?

Being a bag holder is pretty straight forward. It is essentially a term for someone who is left holding the “bags” after someone else has run off with the money.

Rolls off the Tongue, LEFT HOLDING THE BAG Origin: By Andyman1943 
www.toondoo.com
www.toondoo.com

In the world of stock trading, more often than not, this is the retail investor. Retail investors come to the market with little knowledge of how the market works or how it is designed to take advantage of them — over and over again.

Obviously, the modus operandi of influential and well-funded market participants is to generate demand for their products, i.e. certain stocks. We call them market makers. After all, it is their job to work for companies or institutions who’ve acquired a certain amount of shares and need to make a profit off those shares.

Why bag holders are needed in the market

In order to turn a profit, market makers need someone to sell to. It’s no different than any other marketable product. Buy up all the “widgets” at a wholesale price and store them in a warehouse. Create demand for the widgets, mark up the price, and soon everyone will be wanting your widgets.

As word gets out, like the recent AMC buying frenzy, everyone and their neighbor believes they are going to get rich by buying widgets and selling them when they reach $1000.

After all, that’s the story that all the online promoters and influencers have sold to you right? All it takes is a little fervor in the storyline, and an army full of sheep to believe it, and the market makers have the perfect exit.

Little do they know that there is no other way for market makers to get rid of all those widgets in the warehouse at once. They need a sea of buyers. And as the price rises and rises quickly, they take advantage of the demand to dump all the widgets into unassuming retail buyer’s hands.

Hence, they leave with the money, and you’re left as a the widget bag holder.

Example 1 of a bag holder

Let’s use the AMC example mentioned above in order to gain a perspective of what bag holding looks like on a chart.

AMC buyers left holding the bag.

Notice on the chart that the stock price more than tripled in a matter of a few days. As the stock continues to rise, it creates a sense of “fomo“. Every one is calling their mother and grandmother and 2nd cousin, Bill, and telling them to buy AMC because it is going to the moon.

The talking heads on CNBC and Reddit and Twitter and everywhere else are all fueling the fire. In essence, the fomo meter is completely maxed out. Get in now, or you’re going to miss out!

Stock Market Fomo Meter

So you hesitate, you buy late, and then you HODL (Hang On for Dear Life) hoping you’re going to get rich when AMC goes to the moon.

Unfortunately, as you’re buying, the market makers are cashing in all those pretty little AMC shares that they accumulated at a much lower price. Your FOMO is their exit strategy.

The result, whatever you invested was cut in half as the price dropped 60% from the highs.

How to use bag holding to your advantage

Now that we’ve painted such a grim and menacing picture of bag holding, let’s look at a simple trick. This trick will allow you to use bag holding to your advantage.

The concept of bag holding actually centers around volume weighted average price. We’ve got plenty written on it.

Suffice it to say, a volume weighted average price will tell you at what price “most” of the market participants are “averaged” into the stock. This gives you an indication of the “over/under” for who is holding the bags.

To that point, when a stock is in a sideways trading range, it’s likely that the bag holder hasn’t been determined yet. If a stock is breaking down from a consolidation at the highs, longs are probably holding the bags. And vice, versa.

Let’s look at an example.

Using VWAP Boulevard and Anchored VWAP to find bag holders

There are two indicators we really like when trying to find the bag holders in a stock: vwap boulevard and anchored vwap.

We’ve written extensively on them, so be sure to check out those articles linked above.

Now, let’s look at our AMC example again, but this time with VWAP Boulevard indicators turned on.

VWAP Boulevard can help you find bag holders

Notice in the chart above that there are 5 lines. Most of them are pastel pink and purple. However, the one we have annotated as VWAP BLVD #1 is black. This is the most important vwap boulevard line. It represents the closing vwap of the highest volume day on the chart.

Volume is king in trading. It gives you so much information as to supply and demand and big events in the market.

In this example, notice how the price of AMC fumbled around that vwap boulevard line for many days following the climactic push. This is your over under line. As price begins to break down from that point, it becomes clear that buyers are the bag holder. This is your signal to get out and cut your losses quickly.

Consequently, the price later found some support at a lower vwap boulevard line, VWAP BLVD Line #3, but only after a massive decline in price. So, as you can see, these lines are always worth a look when analyzing price charts.

Using Anchored VWAP to find bag holders

In the same chart below, we’ve now added a red anchored vwap from the highest volume day on the chart. Notice how it acts similarly to the vwap boulevard line we have drawn.

Anchored vwap helps find bag holders

This can be another tool in your belt when trying to find the over/under line for bag holders. Once they start sinking, buyers are now under water.

What happens when someone holds the bags when they are shorting stocks?

Bag holding doesn’t have to be just for buyers. You can have sellers holding the bags as well. In fact, if you are a buyer of stocks, you probably want sellers to be the bag holder. This is the thesis behind all of the short squeezes that have been so popular lately.

Essentially, just like the AMC example above, when short sellers pile into a stock, they expect it to go down. However, if there is enough demand present, the sellers can quickly become overwhelmed as the stock price continues to rise.

Unfortunately, this can lead to catastrophic losses for short sellers, but exponential gains for buyers. Check our recent podcast for an example of how a short squeeze can blow your account.

Let’s look at an example of what this might look like with a quick examination of liquidity traps.

Liquidity traps create short seller bag holders

To trap shorts, you first want to create a high volume day and give shorts the upper hand by the end of the day. Notice HLBZ below has done just that.

HLBZ gap day
HLBZ gap day

Then, you want liquidity to dry up in the ensuing days, while maintaining price at key levels. This creates a predicament for short sellers. How? You might ask?

If you’re going to take a strong short selling position, you need plenty of time and lower prices in order to get out of your position and take profits. If price is kept high enough, and no more selling pressure comes in, this could spell Barney Rubble (trouble) for shorts.

Notice how in the next image, the second day, volume completely dried up:

HLBZ day before liquidity trap

And then the next day, it was carnage for short sellers. Some news created a catalyst for longs to come in, and shorts began to cover as quickly as possible, fueling a squeeze.

HLBZ Liquidity Trap
HLBZ Liquidity Trap

You might be asking, but how did you know the over/under line for shorts to become bag holders? This goes back to vwap boulevard again. Let’s look at this example with vwap boulevard drawn on the highest volume day in JFIN.

JFIN liquidity trap
JFIN liquidity trap

Note the wick on the first high volume candle. Lots of selling pressure. Then price holds vwap boulevard as volume dries up the next day. Price begins to rise on the third day, and shorts are soon under water.

How to avoid becoming a bag holder

Honestly, it’s a matter of education and discipline. If you don’t understand market dynamics and technical analysis, you’re going to have a hard time making money. Unless, of course, you get lucky. But, luck runs out some times.

The great investor Bill O’Neil taught that you should buy stocks in an uptrend that have paused and then resume their uptrend. This gives you a great opportunity to buy something that is strong. Buying high and selling higher seems counterintuitive, but it’s a lot better than being a bag holder.

Think about it this way, if a stock is showing weakness and beginning to break down, like AMC above, how do you know it will eventually rally? Why not keep your eye on the over/under and save your cash by selling for a small loss. The longer you hold a loser, the more your hard-earned cash depletes.

Follow these guidelines to avoid being a bag holder:

Conclusion

Here at TradingSim, we believe the fastest way to consistent profitability is through trading replay and simulation. By all means, study study study all the gurus you want, but put their strategies to practice in a trading simulator first.

If you don’t want to take our word for it, take it from the worlds most renowned trading psychologist, Dr. Brett Steenbarger.

Here’s to good fills!

5m Charts Banner

In this article, we will cover everything you need to know about 5-minute charts. First, we will touch on the basics of the 5-minute chart. Next, we will move onto two popular chart patterns using the 5-minute charts. Lastly, we will cover advanced trading techniques of combining indicators and multiple time frames.

5-Minute Bar Definition

5-minute charts illustrate the summary of a stock’s activity for every 5-minute period within the trading session.  The core market session is 6.5 hours per day [1]; therefore, a 5-minute chart will have 78 five minute bars printed for every full trading session. 

Day traders are commonly trading 5-minute charts to identify short-term trends and execute their trading strategy of choice.

Where to Select the 5-Minute Time Frame

Most trading applications will allow you to select the time frame to analyze price data. Within the Tradingsim platform, you can select the 5-minute interval directly above the chart.

How to Select 5 minute candles
Select 5 Minutes

The close on 5-minute charts gives insight into the immediate market direction of the trend for a stock.  When a stock closes at the low or high of the 5-minute bar, there is often a short-term breather where the stock will go in the opposite direction. 

The psychology behind this is that the stock has been pushed to an extreme as other active traders chase the price trend. This breather can mark a major reversal, but in the majority of cases, it creates the environment for a counter move.

How Do You Trade 5 Minute Charts?

Bar any exhaustive scientific studies, we would dare to say the 5-minute chart is one of the most popular time frames for day traders.

5-minutes provides you with the right mix of monitoring the details, without scalping, and conversely allowing you to avoid waiting for 10, 15, 30 or 60-minutes to pull the trigger as well.

It’s that fine line where most traders feel comfortable within this time unit of measure. It also quietens the noise of 1 and 2 minute charts.

Now, let’s dive into a few strategies you can use with this time frame.

The Morning Reversal Strategy

Most of the liquidity and trading activity in the market occurs in the morning and near the close [2].

In the morning, stocks will trend hard for the first 20-30 minutes into the 10 am reversal time zone. Day traders that are looking to go opposite to the trend can wait for a close at the high or low of the 5-minute bar to go opposite to the morning move.

The morning reversal short has a high success rate. There is something about the retail trading market in the morning that brings a fresh batch of bag holders chasing the market for quick gains every morning.

The smart money will grab the breakout and ride the market for quick profits. However, new traders will either hold on too long or jump on the bandwagon too late, perhaps on a breakout that fails like this OCUP example below:

Bearish Engulfing Morning Reversal on 5 minute charts
Bearish Engulfing Morning Reversal

The 5-minute chart time frame is often too large to capture the volatility of the move heading into the 10 am reversal. This can be a blessing or a curse depending on how you like to trade.

Candlestick Patterns Can Help

Notice that in the example given above with OCUP the failed breakout candle on the 5 minute chart is a bearish engulfing candle.

We won’t go into great detail on these strategies in this article, but we have a great resource for identifying bullish patterns and bearish candlestick patterns on the site.

Let’s review another chart example of a morning reversal where the stock climbs higher, only to reverse lower. This pattern is actually more common than you would think.

Morning Reversal Strategy
Morning Reversal

This is the 5-minute morning reversal you are going to see most often. There is a slight pop in the morning and then after a move higher, a sharp reaction lower.

As you can see from the spinning top at the 6th 5 minute bar of the day, we have supply entering the market. We then get a breakout from that level that fails — a great opportunity to get short.

As always, treat trading 5-minute charts in the morning seriously, especially on the short side. Always put your stops in.

Trading Breakouts

In addition to pullback trades, breakout trades are also a big part of active trading. For these setups, you want to find stocks that are up considerably in the pre-market or with volume right off the open.

Next, you want to make sure they have little to no overhead resistance.

If you are open to more risk and would like to reap more rewards, then you will want to set your eyes on low float stocks.

If you are looking to play things a little safer, then look to stocks with a float north of 100 million shares.

But no matter your risk appetite, the key to success is cutting your losers and letting your winners run.

5 Minute Chart Morning Breakout Example 1:

Morning Breakout of 5 Minute Chart

If you trade pre-market, then your range can develop in the early am and you could be in a trade as early as 9:31 in the morning. However, if you do not use pre-market data, you will want to focus on the opening range.

You might also find a solid breakout strategy using our small account building setup.

Next, you want a stock with volume that can push the price higher [3].

Lastly, you shouldn’t fall in love with these high flyers. Most of them will run their course in ten to thirty minutes.

So, remember to keep your stops tight and to take profits as the stock goes higher.

5 Minute Chart Morning Breakdown Example:

5 Minute chart breakdown

These breakout trades also work on short positions. In the above chart, notice how VLON broke down after already having a strong gap to the downside.

After a while, certain patterns will emerge that you can use to improve the accuracy of the trades you place.

In the next section, we are going to go beyond chart patterns and dig into various indicators you can use with 5-minute charts to find profitable setups.

How to Enter and Exit Trades on a 5-Minute Chart with Oscillators and Fast Lines

Oscillators do just that, they oscillate between high and low extremes.

Yet, oscillators give many fake signals.

According to Martha Stokes, CMT from technitrader.com,

“Most traders are told to use Stochastic as an Overbought exit or sell short signal, and an Oversold entry or buy signal. This simplistic approach worked well prior to the 1990s and the advent of electronic trading plus massive institutional trading activity. However, this is far too simple an approach for the faster-paced more dynamic and complex marketplace of today, where short term trading dominates more than ever.” [4]

Since they are leading indicators, oscillators point out that a trend might emerge, but it is no guarantee.

For this reason, oscillators are one of the most attractive tools for day traders as timing is of the essence.

Nevertheless, if not used properly, they often lead to failure. Therefore, we recommend combining two oscillators when trading on a 5-minute timeframe in order to validate trade signals.

Personally, we like oscillators only for trade entry and not trade management.

Therefore, we recommend you include a fast line on your chart in order to attain exit points on 5-minute stock charts. Some of these lines could be a regular Moving Average, DEMA, TEMA, Hull MA, Least Squares MA, Arnaud Legoux MA, etc.

In this section, we will cover 3 simple strategies you can use with 5-minute charts and indicators.

Strategy #1 – Stochastic Oscillator + RSI + Triple EMA

This simple strategy uses a three-pronged approach across two oscillators and an on-chart moving average indicator.

Entering a Trade

Trade entry signals are generated when the stochastic oscillator and relative strength index provide confirming signals.

Trade Exit

You should exit the trade once the price closes beyond the TEMA in the opposite direction of the primary trend.

There are many cases when candles move partially beyond the TEMA line. We disregard such exit points and we exit the market when the price fully breaks the TEMA. Have a look at the example below:

5-minute chart with oscillators

This is the 5-minute chart of General Motors. The two instruments at the bottom of the chart are the Stochastic Oscillator and the RSI. The TEMA is the green curved line on the chart. The green pairs of circles are the moments when we get both entry signals.

How to Use the Indicators

First, we spot overbought signals from the RSI and the stochastic and we enter the trade when the stochastic lines have a bearish crossover. We go short and we follow the bearish activity for 15 full periods, which is a relatively long period of time for a day trader. Good for us!

We exit the trade once the price closes above the TEMA. This short position generated a profit of $0.43 (43 cents) per share, which is a decent amount even for advanced trading strategies.

Later, we receive a few more overbought/oversold signals from the stochastic, but they are not confirmed by the RSI. Thus, we stay out of the market until the next RSI signal.

Our second trade comes when the RSI enters the oversold area just for a moment. This long signal is confirmed by the stochastic, so we go long. The bullish move that ensued is minor, but still in our favor!

We hold this trade for 9 periods before closing the position. We exit the market when a bigger bearish candle closes below the TEMA with its full body. This long trade brought us a profit of $0.09 (9 cents) per share.

On the next day, we manage to identify another long signal from the stochastic and the RSI.

We hold the long position open for 14 periods before one of the bearish candles on the way up close below the TEMA. This long position generated a profit of $0.46 (46 cents) per share.

Strategy Results

  • 3 Positions
  • 2 long
  • 1 short
  • Time in the market: 3 hours and 10 minutes
  • Total profit: $0.98 (98 cents) per share

Strategy #2 – MACD + MFI

For this next strategy, we will combine the Moving Average Convergence Divergence with the Money Flow Index. We will enter the market when we receive confirming signals of the MACD and the MFI.

However, for how long will we hold the trades?

Notice that in this stock trading setup we have no on-chart trading indicator for identifying exit points.

The reason for this is that the MACD does a pretty good job of this itself.  We will simply exit the market whenever the MACD has a crossover in the opposite direction!

Notice that when using the MACD for exit points, you stay in the market for a longer period of time.

5-minute chart + MACD + MFI

This is the 5-minute chart of McDonald’s for Sep 30, 2015. The two instruments at the bottom of the chart are the MACD and the Money Flow Index. The green circles indicate the entry signals we receive from the two indicators. The red circles indicate the moment when the MACD tells us to get out of the market.

Notice that in this example, the exit point of a position is the entry point of the next one. Thus, the red and the green circles match in three cases.

How to Use the Indicators

In the first trade, we have matching bearish entry signals from the MFI and the MACD. We short McDonald’s.

Although there is strong hesitation in the price movement, no exit signal is provided from the MACD and we hold our position. Later on, the price moves in our favor and we close the trade when the MACD has a bullish crossover. We were short for 34 periods and generate a profit of $0.33 (33 cents).

As we said, in this strategy example, we often open a contrary position right after closing the trade. Therefore, once we received the exit crossover from the MACD, the MFI gave us a long signal.

We stay in the market for 36 periods until the MACD gives us a bearish crossover. We collect a profit of $0.56 (56 cents) per share from this trade – slightly better than the previous example.

The MFI is already high and we immediately open a short position after the MACD crossover from the previous position. McDonald’s starts to move in our favor, but the direction changes rapidly. Yet, the two lines of the MACD interact, but they do not create a crossover. Thus, we hold our short position for 39 periods.

In this trade, we accumulated a profit of $0.81 (81 cents) per share – much better!

With the exit of the previous position came the entry point for the next trade. This is so because the MFI was already down when the MACD exit crossover appeared. Thus, we go long and we enter the best trade of the four! We hold McDonald’s for 27 periods before the MACD gives us a bearish crossover. This long position generated a profit of $0.88 (88 cents) per share. Well, that my friend is a good trade!

Strategy Results

  • 4 Positions
  • 2 long
  • 2 short
  • Time in the market: 11 hours and 20 minutes
  • Total profit: $2.58 per share

Strategy #3 – Klinger Oscillator + RVI + 12-Period Least Squares MA

This 5-minute chart strategy involves the Klinger Oscillator and the Relative Vigor index for setting entry points. We try to match long and short signals with the two oscillators, which will be an indication to trade the equity. When we get these two signals, we open a position and we hold it until we see a candle closing beyond the 12-period LSMA.

5-minute chart + KO + RVI + LSMA

This is the 5-minute chart of Yahoo. The two instruments at the bottom are the RVA and the Klinger. The blue curved line on the chart is the 12-period LSMA. On this chart, we have four trades. The green circles show the four pairs of signals we get from the RVA and the Klinger.

How to Use the Indicators

First, we get a bullish signal from the Klinger, which is confirmed by the RVA after 4 periods. When we get the confirmation, we go long. We manage to hold the trade for four candles before we see a bearish candle below the LSMA. We get $0.10 (10 cents) per share from this trade.

Four periods later, the Klinger and the RVA give us bearish signals at once and we go short. We get a slight bearish move of four periods before a candle closes below the LSMA. We generate $0.12 (12 cents) per share more.

The third trade is the most successful one.

Six periods after the previous position, we get matching bullish signals from the Klinger and the RVA. Thus, we go long with Yahoo. We manage to stay for 9 periods in this trade before a candle closes with its full body below the 12-period LSMA.

Notice that at the end of the bullish move, there is another bearish candle, which closes below the LSMA, but not with its full body. Therefore, we disregard it as an exit signal. This long position brings us a profit of $0.37 (37 cents) per share.

With the next candle, we get bearish signals from the RVA and the Klinger and we go short with the closing of the previous long position. We get out of this trade after 5 periods when a bigger bullish candle closes above the LSMA. This trade generated a profit of only $0.03 (3 cents) per share.

Strategy Results

  • 4 Positions
  • 2 long
  • 2 short
  • Time in the market: 2 hours and 10 minutes
  • Total profit: $0.62 (62 cents) per share

Which 5-minute bar trading setup is better?

The trading strategy we prefer when trading 5-minute charts is the MACD + MFI. The reason for this is that this strategy distributes the trading along the entire trading day.

In the example above, we covered the whole day with only 4 trades. Furthermore, we generated an impressive amount per share!

In the other two strategies, the number of trades per day will be significantly more. As you see with MACD + MFI, we traded 4 positions for 11 hours, while with Klinger, RVI, and LSMA, we traded 4 positions for only 2 hours.

Yet, some of you will like fast-paced trading and will like to exit the market more frequently. Just remember in trading, more effort does not equal more money.

Using Multiple Timeframes

One thing you will want to do with 5 -minute charts is to use multiple time frames to help support your point of view.

In reality, 5-minute charts are great for stocks with lower volatility. However, if you are trading low float stocks you will want to use a one-minute or two-minute chart to track price movement.

While you are monitoring price movement on a lower level, you will also need to monitor the bigger trends.

To do this, you will want to look at a daily or hourly chart.

So, when you are setting up your trading desk, have multiple charts up of the same stock. Below is a screenshot from Tradingsim of an example of how you need to view stocks on multiple time frames.

Multi-time Frame View

In the above chart, notice how VLON has three time frames, 2-minute, 5-minute and daily.

The 5-minute chart is your anchor and was showing a consolidation was taking place. The two-minute chart also displayed a similar consolidation pattern.

Lastly, the daily chart shows that after a nice run-up, VLDN was starting to stabilize after a retracement of the rally.

So, in this example, as a trader, the big thing you are looking for is alignment of the same narrative across multiple time frames.

Summary

Even if you are not trading 5-minute charts, it is essential that you keep an eye on them.  The majority of day traders are using 5-minute charts to make their trading decisions.  Therefore, these traders tend to control the action. 

If you are trading with 15-minute charts, be mindful that a sharp counter-trend move can occur at the close of a 5-minute bar.

Remember, a close at the high or low of a 5-minute bar is a potential indication that a minor reversal is in play.  Day traders should not immediately exit their winning position but should rather look at this as a sign of a potential trend change.

Be sure to study candlestick patterns to help with your strategies.

Also, the morning is where all the action takes place in the market. If you are going to trade during this time of day, remember the two most common setups – pull back and the breakout.

Lastly, 5-minute charts can’t do it all by themselves. You will need to assist help from other time frames. The one minute chart for very volatile stocks and the daily charts to identify long-term trends for support and resistance levels.

External References

  1. Holidays and Trading Volumes. New York Stock Exchange
  2. Lee, Justina and Peterseil, Yakob. (2019).Wall Street Fights Stock Machines With Trend-Chasing on Steroids. Bloomberg.com
  3. Sincere, Michael. (2011). ‘Start Day Trading Now: A Quick and Easy Introduction to Making Money While Managing Your Risk‘. Simon & Schuster. p. 41
  4. Stokes CMT, Martha. (2015). ‘How To Use Stochastic Ideally‘. Seeking Alpha.com

When it comes to trading education, it can often seem like the wild west. Unless you go the route of a Chartered Market Technician certificate and study the old titans of technical analysis, your options for trading education are quite varied. Within this vast landscape is a myriad of day trading chat rooms, offering the opportunity to trade live with professional traders. In this post, we’ll offer up some advice on how to make the most of any chatroom, as well as what to avoid.

Free vs. Paid Day Trading Chat Rooms

These days, you’ve likely been bombarded with someone flashing their profit and loss statements in a 30 second YouTube commercial. Their goal is to attract you with the hope of making the same money by following their paid service.

Similarly, there are quite a few free chat rooms that have popped up since the pandemic hit. These chat rooms are run by professional traders as well, but don’t require any payment, obviously. Typically, you find out about them by word of mouth or within the social fintwit community.

Most of these chats, whether paid or free are migrating towards applications like Discord to run their rooms.

Custom Features in Day Trading Chat Rooms

Whether paid or free, you’ll likely find a lot of value in the features of these rooms. By this, we mean the ability to find information quickly. Some of the coders and developers are really creative in chat rooms.

For example, if you want to find statistics on a particular stock, many rooms have short codes pulling everything from float data, market cap, and even charts. This can be helpful when you are seeing a stock being mentioned in the room, but don’t know much about it.

Likewise, there are rooms which allow you to set price alerts, find accountability buddies, set alerts for specific members when they make comments, and even have specific sounds for certain keywords like “parabolic,” etc. Perhaps you’ll want to mute certain alerts because they don’t play into your strategies. Many allow this as well.

The Numbers

The amount of subscribers in any of these chat rooms can vary. You may find anywhere from a thousand to many thousands in paid chat rooms. Likewise, you may find as many as 10,000 or more in the free chat rooms.

This may seem daunting. And to many, it probably is. The struggle with trading can often be the loneliness that comes with it. Even in chat rooms, you can have a sense of “not belonging,” or getting lost in the crowd. To that end, let’s discuss a handful of ways to make the most out of these rooms.

How to Pick the Best Chat Rooms

It goes without saying that not all chat rooms are going to offer great services. We are not here to tell you which ones to avoid, either. However, you should be on guard. Any Joe Blow can make a dollar in the stock market and throw his PnL up on Twitter and start a chat service.

For that reason, we recommend doing a search for independent reviews. Ask around and see which rooms are the best for education and mentorship. How long have moderators been trading? Ultimately, there is likely something to glean from many of the chat rooms, if your search is objective. We’ll discuss what this means in a minute.

Secondly, joining chat rooms for stock alerts is risky business.

If you’re joining simply to have someone tell you when to enter and when to exit a trade, we’d advise caution. While we understand that many retail traders don’t have the desire to become self-sufficient in the markets, you must be aware that signing up for alert services may simply provide the liquidity that big players need to dump there shares into your hands. Granted, not all alert services will be this nefarious, but in this day and age, even large market participants may keep an eye on alert services knowing how to use them to their own advantage.

At the end of the day, even if you only want to do this part time, we recommend you find a day trading chat room that teaches you how to become self-sufficient. It will pay off in the end.

Studying the Educational Material of Day Trading Chat Rooms

This is far and away the best way to use day trading chat rooms as a beginner. If you are in year 1, 2, or 3 of your trading career, you should be devouring information. Here is how to do this quickly and efficiently.

  1. Subscribe to a reputable service with educational material and archived content.
  2. Devour the educational material as efficiently as you can.
  3. Study the charts and commentary of as much archived content from the professionals in the chat room as you can.

While doing this, you need to be objective. We discuss a lot of this in our post on “How to Find an Edge.” Here are the objectives you need to have:

  1. Does the education material fit your personality and schedule?
  2. Are you more long biased or short biased?
  3. Do the professionals give clear indications as to the probabilities of their strategies?

If you can’t find these answers, you may need to try another service. However, it is likely that you will be able to “piece together” the outcomes of specific strategies if you are diligent enough with your studying. Here’s how to do that:

How to Study Gurus

Gurus can offer a lot of wisdom, but not all gurus are great teachers. And that’s ok! We don’t blame them for it, honestly.

Think about it this way, some of the greatest performers in any field may have a hard time explaining in elementary terms how to get to their level. Once you reach such a level of proficiency, it is difficult to even remember what it was like to be a beginner.

Keep that in mind when you study gurus, but learn how to help them help you.

  • Take their material and find a way to dissect it.
  • Organize the educational and archived material in such a way that you can follow
  • Create a subset of categorized trades and replay them in the simulator

Let’s expound on the last bullet point:

If your guru offers premarket plans on a live stream, and has this archived, take advantage of it. Study in your free time by replaying their premarket video feed for a particular day, and then replaying the exact same market day in TradingSim. Document what worked, what didn’t work, and take annotated screen shots of your “categorized” setups and put them in a folder.

Do this enough times and you will build your confidence on why your guru takes certain trades. Consequently, you will build your own confidence in what trades you should or shouldn’t take.

Find Your “Core Group” from a Day Trading Chat Room

Post-Covid, the work-from-home phenomenon is accelerating. In a lot of ways, this can be great for people. The opportunity to trade and live in your pjs! However, for some people, the lack of meaningful human interaction can become lonely.

Along those lines, we recommend that you use the chat room to find people who resonate with you. We don’t mean finding people who only trade like you or only think like you. Instead, try to surround yourself with people who will make you better.

Even proprietary trading firms like SMB capital are finding that their traders are more consistent when they are paired into teams. Use this to your advantage, bring value to a team, and collaborate with other budding traders from your chat rooms.

Heck, some traders even go so far as to meet up in real-life. In our recent SimCast episode with Ricky Analog, he talks about how 60+ members of his chat service went to an adventure race together recently.

Find Mentors, or Move on

One of the most important aspects of day trading chat rooms is mentorship.

As we say above, there is always something to glean from anyone who has been trading for a while. You may find a new indicator, a new strategy, or some way to read the tape that you hadn’t considered before. Those are reasons to find value learning from others in a chat room.

However, if you are not finding proper mentorship along your journey, we recommend you find a new place to grow. Ricky Analog mentioned this in his talk at Traders4aCause this year. Ricky is a huge proponent of mentorship and recommends finding as many as you can along your journey.

We couldn’t agree more.

As a growing trader, you should never limit your perspective. Keep an open mind and keep growing by reaching out to new mentors. Just keep in mind that you will get out of mentorship what you put into it. Bring value to the table, and be willing to put in the legwork behind the scenes.

There are no free lunches in this business.

5 Things to Avoid in Day Trading Chat Rooms

While we certainly agree that live chat rooms can be a great way to learn how to day trade, there are a number of things to watch out for.

1. Avoid the US vs. Them Mentality

We live in a time where online gaming has become prolific. Much like competitive sports, the gaming mentality has found its way into trading now.

Many of the traders in paid chat rooms and free chat rooms are now watching both rooms at the same time. With tens of thousands of traders all watching the same tickers each morning, and keeping a check on all the chat rooms, what we’ve found is a competitive mindset creeping into the landscape.

Often times, one room will be more long-biased and others more short-biased. As you can imagine, this creates an “Us vs. Them” mentality akin to gaming.

We would advise you to steer away from this mindset. Most of what this centers around are the smaller, more manipulated stocks in micro-cap land. It’s entirely possible that so many followers in so many rooms could potentially have an effect on the price movement in these stocks. However, not all price movements are a result of a chat room “out to get you.”

Nonetheless, if you decide to trade these stocks, keep your eyes on the supply and demand. Trade the ticker, not the chat room. It can easily become a crutch to blame the price movements on this chatroom or that chatroom. But, at the end of day, it’s up to you and your ability to read volume and price action.

2. Watch out for Bias

Because of the herd mentality, it can be easy to find yourself affected by the biased comments in the room. To avoid this, always take an objective approach. Never take anyone’s comments at face value. Do your own homework on the trade and make a decision for yourself based on the homework you’ve done on strategies.

3. Avoid FOMO

Chat rooms can be exciting. And rightly so. It’s 1000s of traders getting together in one room to make money. Who wouldn’t be excited?

Stock Market Fomo Meter

But this is can be very dangerous. Keep in mind that the best trading is often very boring. Why? Because you know your probable outcomes and are less emotional knowing this. To that end, take care that you don’t fall prey to every news release or alert unless it fits your pre-designed trade plans.

Always have a plan, and avoid FOMO at all costs.

4. Be Aware of Success Theatre

Many people in chat rooms will share their good trades and leave the bad ones to themselves. Remember this when traders are posting all their massive gains in the chat room and you feel left out.

There really isn’t anything healthy about sharing wins or losses. Wins and losses are going to come no matter what. What matters is how well you review your process each day, regardless of what other traders are doing.

Unless you can reach out to someone for tips on what he or she did well in the trade, ignore the success theatre.

5. Drama & Profanity

You would think this goes without saying, but drama can be a real drain on the experience. Pick your chat rooms according to your personality.

We tend to treat trading like a business. For that reason, when we’re putting thousands of dollars on the line, we prefer a professional environment.

Perhaps you don’t. There are a myriad of differently run chat rooms on the web. If profanity and memes are your thing, there’s a chat room with that. If nothing but important news information is your thing, there are chat rooms that are tightly run for that purpose.

No two chat rooms will be the same, nor will their strategies. And, ultimately, no chat room is the “best.” It will be up to you to try them out and find the one that fits you the best.

Conclusion

As you search for a place to learn, we hope this has provided some benefit as to what to look for. Keep in mind, as with any industry, there will be well-run businesses, and those that are not run well. Guard your capital and your precious time. Be selective, and bring your own value to the table.