20 Moving Average Pullback Strategy: Great For Short Term Trades [Plus Video Tutorial!]
Category: Futures
See one of the largest free resources on the futures markets. Read posts that cover everything from futures exchanges, fees and trading strategies. If you are interested in the futures markets look no further.
The 20 moving average is an extremely popular indicator in the world of trading. It’s use is ubiquitous no matter the the time frame or the type of stock, commodity, currency, or other issue being traded. Because of this popularity, many traders use it for special strategies in the market. One of those strategies is the 20 Moving Average Pullback.
For a quick overview of how to use moving averages, check out our post here.
Also, have a look at our brief video below explaining how to search for the 20 Moving Average Pullback in the TradingSim scanner:
20 Moving Average Pullback Overview
A rose by any other name smells as sweet. The 20 Moving Average Pullback is no different.
Popularized by great traders like Linda Raschke as the The Holy Grail, or similar to Jeff Cooper’s 50 moving average Expansion Pivots, pullback strategies are simply opportunities to jump on board as a stock pauses during an uptrend.
Cooper says it best as he describes it as “one of the toughest predicaments for traders.”[efn_note]Cooper, J., & Cramer, J. J. (2004). Hit and Run Trading: The Short-Term Stock Traders’ Bible (Updated ed.). Wiley. 31.[/efn_note] That is, knowing how to enter a stock that has left the train station without you. This is where the moving averages come into play.
Intraday Examples
The best way to understand this concept is visually. So let’s have a look at an intraday example of a 20 moving average pullback on stock SGOC.
20 moving average pullback SGOC
Notice in the example above that SGOC “left the train station” in a hurry off the open. However, with some time to consolidate, it found its footing along the orange 20 moving average.
Then, after trying to break away a second time, it pulls back nicely again around 10:50am that morning. Offering yet another opportunity to go long at the 20 moving average.
Here is another example with SEED intraday on the 1 minute:
SEED 20 moving average pullback
Take note of the prior uptrend, the big move, a pullback and consolidation that we’d call a Volatility Contraction Pattern, then a launch party right off the 20 moving average. Twice!
Even the second entry would have been good for a $2+ move in less than 15 minutes.
Daily 20ma Pullback Example
Daily charts can also provide a lot of “bigger picture” ideas for short term traders, even day traders. Think about it this way, if the 20 moving average can provide explosive opportunities on an intraday chart. What if you could anticipate reversals on the daily chart and either swing or day trade those big moves?
Here’s a great example with AMD on the daily. Notice that AMD was trending upward and above the orange 20 moving average.
AMD daily 20ma Pullback
The 20ma provided support with a close just above it on the daily chart the day before a breakout. This is exactly what we are talking about it.
The question then becomes, “How do we anticipate these moves?”
Let’s look intraday to see how you could have found this opportunity by searching for stocks nearing the 20 moving average.
Scanning for Pullbacks
First, take a look at the scanning filter we set to find stocks on this morning that had pulled back to within 1% of the 20 moving average:
Scanning for pullbacks
After running the scan, we notice on our list that we have a number of stocks within 1% of the 20 moving average. This allows us to narrow our results. Here we have AMD showing up on the list!
AMD on list of pullbacks
After identifying AMD, we then have the opportunity to test our intraday strategies for a potential breakout of this tight base it has been forming on the daily chart.
AMD cleared the prior day close in a premarket gap the next day. So the stage for momentum was set. It then retreated off the open and found support on a 20 moving average pullback on the 2-minute chart.
A perfect opportunity to go long!
AMD breakout
By later that afternoon, AMD rose a solid 6% into the close!
AMD 6% gain
As you can see, with the right criteria, pullbacks can be really explosive opportunities, for day trades or swing trades.
Practicing the 20 Moving Average Pullback Strategy
Just as we’ve shown, all it takes is perfecting your chart eye in the simulator to find the right criteria for pullback plays. We have added filters for the 10, 20, 50, and 200 moving averages if you want to try more moving average pullbacks.
Not only that, but we’ve added “trending” criteria if you want eliminate stocks in correction.
Trending Stock Filter
Our hope is that you’ll practice enough of these to know your probability for success, the right entry criteria, and proper risk management before you employ real money in the markets.
VIX futures, short for volatility index is one of the most popular derivatives instruments listed on the Chicago Board Options Exchange (CBOE).
The VIX futures are also known as the CBOE Volatility Index futures or VX for short.
The contracts are tied to the forward 30-day implied volatility of the S&P500 index in real-time.
How Do CBOE VIX Futures Work?
SPX options forecast the volatility between the current day and the expiration date of the contract. The estimates are implied based on how much buyers are willing to pay.
To put it generally, when the market dips, investors, fearful of losing equity purchase SPX PUT options. This results in higher premiums for SPX PUT options, which leads to a spike in the VIX index.
The chart below displays the E-mini S&P 500 futures and the CBOE VIX index. Is there anything that jumps out at you?
Could it be the high readings coinciding with market bottoms?
VIX Index and market bottoms in the S&P500 market
VIX Futures Contract Specifications
Settlement
Unlike other commodity contracts, there is no physical settlement for the VIX. The final settlement date is 30 days before the third Friday of the following month. Generally, VIX futures contracts expire on Wednesday with the last trading day falling on a Tuesday.
Ticker
The ticker symbol for the VIX futures is VX, with some brokers using other tickers such as VIX or VI.
Contract and tick size
There is a total of nine serial contract months available at any point.
Each VIX futures contract is 1000 units. In other words, the contract multiplier is 1000 of the respective forward VIX index value.
The minimum tick size is 0.05 VIX points or equivalent to $50.
Ticker
VX
Contract Months
Monthly
Multiplier
1000
Min. Tick
0.05
Tick Value
$50
VIX Futures Contract Summary
VIX Trading Session
The regular session is from 5:00 pm (previous day) to 8:30 AM and 3:30 to 4:00 PM. There is a small break from 3:15 PM to 3:30 PM and from 4:00 PM to 5:00 PM.
The trading week starts on Sunday at 5:00 PM, so if you are holding any positions over the weekend, you will want to check-in before Monday morning.
To learn more about the trading timeframes for both futures and options, check out the CBOE site.
How to Trade VIX Futures Contracts
First, the VIX index oscillates within a range.
Therefore there are no long-term bull markets to ride like the S&P 500 index. Lastly, due to the volatile nature of the VIX index, being caught on the wrong side of a trade can cost you dearly.
VIX Futures Range 60 – 10 (10-year chart) Source CBOE
The above chart shows a 10-year price history for the VIX futures. You can see that the index oscillates between 60, reached in late 2008 and bottoms out near 10.
Below are a few trading strategies worth testing with VIX futures.
5 VIX Futures Trading Strategies
#1 – Mean Reversion
Mean reversion states when the price rises sharply, price tends to pull back to the mean.
First, wait for volatility to spike.
Bear in mind that the VIX tends to spike on a daily basis. If these spikes do not coincide with a market low or steep selloff, you should filter out these signals.
Trading VIX futures based on mean reversion
The chart above shows a few instances of trading setups where the spike in the VIX index coincides with a bottom in the S&P500 futures. Using this as a confirmation, traders can then look to go short on the VIX targeting the 10-period EMA as the mean.
#2 – Trading based on the VIX/ES chart
A unique approach to trading the VIX is to use a ratio chart of the VIX and the ES futures contracts. You do this by waiting for the ratio to generate a cross of two moving averages, as shown below.
Trading VIX futures based on the VIX ES ratio
Here you can see that the main ratio chart on the left shows a buy signal on the VIX/ES as the moving average crosses up.
Again, you will need to develop further rules to rule out signals as trading every crossover is a sure way to run up commission costs and trading losses.
#3 – The VIX Index and VIX Futures Divergence
In this trading method, you look for divergences between the CBOE Volatility index, VIX and the VIX futures.
The chart below shows the VIX index on the top and the VIX futures chart on the lower half. The areas marked by the red line connecting the highs shows areas of price divergence.
Following this sort of divergence, the VIX futures will often break one way or the other. Its your job to assess the divergence and take a long or short position accordingly.
VIX index and VIX futures divergence
#4 – VIX Contango and Backwardation
Contango and backwardation are two aspects that govern futures markets regardless of the underlying asset.
Contango in VIX futures is where the price of the current month futures is lower than the price of the far-out VIX futures contracts. This simply denotes the fact that investors expect volatility to rise in the future.
Backwardation in VIX futures is where the front-month contract prices are higher than further out contract month prices. It is widely accepted that backwardation often results in a bearish move with the S&P500 in the near term.
Contango and Backwardation can also be compared between the spot and the current month VIX contracts. When the spot VIX closes higher than the current month VIX contracts, it signals backwardation. This closely ties into the previous method of VIX divergence that is described.
#5 – Analyzing S&P500 Markets
Another simple approach to trading the VIX futures is to analyze the S&P500 market itself or the E-mini S&P500 futures. In this approach, the futures trader can conduct a long term analysis of the S&P500 market and wait for the price to reach a specified/identified support level. When this coincides with a peak in the VIX futures, it can serve as a confirmation to go short on the VIX futures.
VIX and ES Markets analysis
The above chart shows the ES markets on the top and VIX futures below.
How Can Tradingsim Help?
The above methods merely outline some of the ways traders can employ techniques to trade VIX futures.
To explore additional strategies, check out Tradingsim.com. We provide access to a futures replay trading platform that allows you to trade the most liquid futures contracts on the global exchanges.
Overview
Futures offers many benefits such as lower trading capital, leverage and the ability to go long or short.
But how do you take advantage of these opportunities? Where should you start as a retail trader?
Many retail traders prefer to take a trading course or invest in a black box trading system.
However, these short cuts don’t help in the long run, as it comes down to putting in the hard work of mastering your craft.
In this article, we will cover the seven best books for futures trading.
What better way to get started with futures trading than a primer that does not get too technical.
The book neither encourages nor discourages you to trade futures.
The book is just right if you are a beginner to futures trading. In short Futures 101 is a professional booklet that could also be called “Futures for Dummies.”
Amazon ratings: 3.6/5 (27 Reviews)
Price: $49.77 (Paperback); $12.06 (Kindle)
#2 – Starting Out in Futures Trading, Mark Powers (2001)
Starting out in Futures trading is a book written for serious speculators.
The book is currently in its sixth edition and covers all aspects of futures trading. It highlights the importance of stock indices, how to choose a broker and the nuances of placing different order types.
Powers served as the chief economist for the Commodity Futures Trading Commission, so he knows what he is talking about.
Donna Kline is a financial news reporter with Bloomberg TV and served as a market analyst for “The Floor Report”. She was a frequent guest on CNBC’s Squawk Box.
Fundamentals of Futures market introduces you to the fundamental aspects of the futures markets.
The book combines quizzes, checklists, and charts to help educate you on the futures markets.
The book is best suited for agricultural commodities, but also does a great job of discussing specifics of the E-mini S&P
Amazon Ratings: 4.3/5 (13 Reviews)
Price: $8.00 – 39.69 (Paperback); $29.03 (Kindle)
#4 – Technical Analysis of the Futures Markets: A Comprehensive Guide to Trading Methods and Applications, John J. Murphy (1986)
Don’t let the year of the publication fool you. If you have had any experience with technical analysis, you know John J. Murphy is perhaps the most well-known name.
The face of Stockcharts.com, Murphy is a thought leader in the technical analysis space.
Technical Analysis of the futures markets takes the reader into different techniques and patterns. The book lays a good foundation from which you can build upon.
Amazon Ratings: 4.3/5 (25 Reviews)
Price: $14.88 (Hardcover)
#5 – Long-Term Secrets to Short-Term Trading, Larry Williams (2011)
Mike Bellafiore is a well-known name among the prop trading circles. Owner/co-founder of SMB Capital, Bellafiore gives you tons of insights into how professional traders operate.
Mike Bellafiore’s One Good Trade has received rave reviews from some of the well-known authorities in the financial markets including Brett Steenbarger, a Ph.D. on trading psychology and a professional trading coach.
One Good Trade will take you on a journey and provides a view into the trading mindset, more so than just charts and strategies.
Amazon Ratings: 4.2/5 (123 Reviews)
Price: $42.98 (Hardcover); $41.61 (Kindle)
How Can Tradingsim Help?
After you have had the time to soak up the knowledge expressed in these books, test out these strategies within Tradinsgim. We currently have over 20 highly liquid contracts for you to practice with in order to master your craft.
What Does it Mean when Contracts Rollover?
Unlike stocks or spot markets where the instrument can trade in perpetuity, futures contracts have a set rollover or expiration date.
“Rollover” refers to the process of closing out all options positions in soon-to-expire futures contracts and opening contracts in newly formed contracts.
The rollover process impacts market volatility, prices, and volume.
Why do Futures Contracts Rollover?
Futures contracts track the prices of the underlying market. A futures contract is where a buyer and seller agree to contract size, price and future date of delivery. Most traders in today’s market to hedge against market exposure rather than taking physical delivery of the asset.
The below table illustrates the S&P 500 E-mini futures contract and the corresponding settlement date.
Futures Contracts First and Last Trade Date example
By the contract rolling over, the investor never has to deliver the physical asset.
Settlement of Futures Contracts
Since we have covered why futures contracts rollover, let’s now dive into the two methods of how futures contracts are settled.
Physical Settlement of Futures Contracts
Physically settled futures contracts are more prominent in non-financial markets or commodity markets.
These include grains, livestock, and precious metals where there is an underlying commodity.
After the futures contract expires, it is the job of the clearinghouse to match the holder of the long contract and the holder of the short contract. The trader holding the short contract is required to deliver the underlying asset to the holder of the long contract.
To make the exchange, the holder of the long contract must place the entire value of the contract with the clearinghouse in order to take delivery of the asset.
This can be a costly affair and can vary from one market to another. For example, one contract of crude oil controls 1000 barrels of oil. At a price of $50 per barrel, the holder of the long contract must deposit $50 x 1000, $50,000 with the clearinghouse to take delivery. On top of this, there are additional costs of storage and delivery that the buyer must pay for.
As you can see from the above, taking physical delivery of a commodity can be expensive.
Cash-settled futures contracts
Cash-settled futures contract provide cash instead of physical delivery of an asset. Many financial futures contracts fall under this category such as the E-Mini contract. The futures contracts settle for cash after expiration.
The prices are marked to market, and the futures trader’s account is either debited or credited depending on whether the trader was long or short.
Contracts Rollover Date Windows
Example of Futures Roll Date, E-Mini S&P500
Last trading day is the date when you can trade the futures contract (open/close/modify your position). After the last trading day, all positions are set to ‘close only’ mode.
Expiration day is the date that a futures contract is binding for. After expiration, the contract is no longer valid.
Expiration hour is the hour when a futures contract expires. In most cases, this is during the last trading hour of the expiration day.
How Do Futures Behave Heading into a Contracts Rollover Period?
First, not all futures rollover at the same time.
The below graphic provides details of the trading behavior for the new and old contract.
Futures Contracts Rollover – Trading Cycle
In most cases, your futures broker will automatically close out the position. However, it is in your best interest not to let that happen but rather focus on managing your position before the expiration date.
There is usually a few days gap between the last trading day and the expiration day, this is known as the roll date. It is during these days that volatility picks up.
Roll dates are unique to each contract and can vary in duration. As an example, the roll date for the emini S&P500 futures is around eight days prior to expiration date.
The period of roll date is one of the most volatile periods as it marks the end of the current contract and the beginning of a new contract. Therefore, volumes will start to shift significantly as traders start closing out the positions on the existing contracts and open new positions in the fresh or the front month contracts. Price volatility can be seen in both the contract periods.
It goes without saying that traders who trade a contract during the roll dates will find it difficult to manage their traders and traders should also expect to see slippage in prices.
Trading volumes during these periods are typically split between the expiring contract and the new contracts leading to large price swings and gaps. The roll dates influence not just volumes but can also lead to higher spreads which makes it difficult to enter or exit from a day trading perspective.
Witching Days and Futures Contract Expiry
Futures Contract Expiry
You might have heard of the term triple witching and quadruple witching. While it has nothing to do with Halloween, double, triple and quadruple witching refers to a phenomenon when different asset classes or derivates expire on the same day.
These periods can see a high level of volatility and can lead to erratic market behavior.
Double Witching
Double witching takes place on the third Friday of the month, eight times a year. It is when contracts for stock index futures and stock index options expire on the same day. Double witching happens eight months in a year except in March, June, September, and December.
Triple Witching
Triple witching is a phenomenon when stock index futures, stock index options, and stock options all expire on the same day.
It usually takes place on the third Friday of the month. It occurs during March, June, September, and December.
Quadruple Witching
Quadruple witching is similar to triple witching except that in addition to the three asset classes that expire, even the single stock futures expire on the same day. It also takes place four times a year during March, June, September, and December on the third Friday of the month.
The period surrounding the roll dates are often challenging times for traders. Therefore, traders should reevaluate their strategy during these periods.
In Summary
Day traders need to be aware of the volatility that takes place during rollover periods.
These expiration periods are nothing to fear. Your futures broker will send multiple alerts in the weeks and days leading up to a contract’s expiration.
Understanding rollover dates can better prepare you as a day trader for macro-level moves in the market. This can help you determine for example if a breakout or pullback strategy is more appropriate for the market environment.
Good luck trading and to test out strategies related to contract rollover dates, please check out the futures platform within TradingSim.
To learn more about how futures contract rollover, please see this YouTube video.
Before we cover the top performing silver ETFs we will first discuss the basics of silver ETFs. It’s important we ground you on the commodity before diving into top lists.
Silver ETFs – Quick Facts
Silver has often been referred to as poor man’s gold. Despite this nickname, silver ETFs have a real purpose in that they can be used as a a hedge to diversify portfolios in the precious metalsmarket.
Silver is measured in ounces and in most cases tracks the spot price of the commodity.
Silver ETFs have been around since the early 2000s and offer investors an attractive investment product relatively cheap.
The iShares Silver Trust (Ticker: SLV), managed by Barclays Global Investors and launched in 2006 started the popularity among investors in silver ETFs.
Why are Silver ETFs Popular?
Silver ETFs are easier to manage for investors compared to futures or other derivatives because of accessiblity and less competition from savvy investors..
Another attractive feature of Silver ETFs is they are usually held in the physical form. For example, the iShares Silver Trust (SLV) are held in the bullion form in London as good delivery bars. SLV also holds the bullion in New York and other locations. This will prove useful for all your Walking Dead fans that feel the end is near and electronic records will vanish.
Lastly, silver is one of the preferred safe haven assets during times of economic, political or financial uncertainty. Investors also turn to silver (besides gold) and many view it as an alternative currency to central banks.
Why Invest in Silver ETFs?
Investing in silver ETFs offers a more afforadble way to gain exposure to the metal compared to owning the physical commodity outright.
Silver ETFs also offer more diverse means to gain access to the silver market. For example, some ETFs track the silver miners which are the bloodline for silver on the production side. Other silver ETFs include leveraged as well as inverse ETFs.
What are the Key Considerations of Owning Silver ETFs?
As with any ETF, there are three important factors to consider related to costs:
Expense ratios
Daily average volume
Underlying assets of the ETF
Expense Ratio
Expense ratio for any exchange traded fund is the annual fee paid by the holders of the ETF. It is expressed as a percentage of the assets and is deducted during the fiscal year as part of the ETF’s fee.
For example, the iShares Silver ETF charges an annual expense ratio of 0.50%. This means that the fund will cost $5.00 in annual fees for every $1,000 invested.
Daily Average Volume
When it comes to investing in silver ETFs it is important to take into account the daily average volume. Generally, the higher the daily average volume, the lower the expense ratios and other costs.
Choosing a silver ETF with higher daily average volume can protect you from abrupt price movements. Higher volume also makes it easier to buy or sell with ease and at your desired price.
Underlying Assets
Not all silver ETFs are the same. The most conventional silver ETFs are those that directly track the spot price of silver. Besides this, traders can also invest in silver ETFs of mining companies tracking production and silver ETFs tracking derivative contracts.
Top Five Most Popular Silver ETFs
There are many silver ETFs to choose from these days. Each type of silver ETF can cater to a particular need of you the investor.
Silver ETFs can be direct or indirect ETFs. Direct silver ETFs either track the underlying spot price or invest in mining or production companies. Indirect silver ETFs track the various derivatives. Common examples of indirect ETFs are inverse or leveraged silver ETFs.
Investors seeking higher returns (with higher risk) can of course invest in leveraged and inverse silver ETFs. The leverage can be 2x or even 3x. Similarly, inverse leveraged ETFs gives the investor the ability to profit during bear markets without having to short sell.
The table below shows the top five silver ETFs based on total assets under management expense ratio and spread.
TICKER
FUND NAME
ISSUER
EXPENSE RATIO
AUM
SPREAD %
SEGMENT
SLV
iShares Silver Trust
BlackRock
0.50%
$5.17B
0.06%
Commodities: Precious Metals Silver
SIL
Global X Silver Miners ETF
Global X
0.65%
$411.10M
0.16%
Equity: Global Silver Miners
USLV
VelocityShares 3X Long Silver ETN
Credit Suisse
1.65%
$361.21M
0.10%
Leveraged Commodities: Precious Metals Silver
SIVR
ETFS Physical Silver Shares
ETF Securities
0.30%
$328.49M
0.07%
Commodities: Precious Metals Silver
AGQ
ProShares Ultra Silver
ProShares
5.28%
$208.46M
0.11%
Leveraged Commodities: Precious Metals Silver
When investing in silver ETFs, look at the annual expense ratios and the daily average volume. These variables will give a quick snapshot on the costs of holding the silver ETF.
Some silver ETFs are also cheaper but they come at the risk of lower liquidity and higher spreads.
If you want to trade or invest in silver ETFs it is important to understand the outlook for the market as well.
What is the outlook for the Silver Market?
Let’s review the spot silver market to gain a rough outline of where the silver commodity is heading.
After reaching a peak of $48.02 in early 2011, silver prices have dropped significantly. Silver prices, especially over the past four years have settled to in a range between a high of $21.20 and low of $13.88.
This partly comes from the fact central bankers have turned more hawkish. With tightening interest rates, improving global trade and a strong economy, the demand for silver as a safe haven has fallen.
Spot Silver – Market Outlook
With economic policies aimed at reducing corporate tax, the stock markets have been the best place to park your money.
Despite the optimism, the current economic cycle is either mid-way or near the end of its boom. This means, that a possible bust cycle in the global economy is around the corner.
This translates to a potential increase in demand for silver as a safe haven asset. However, no one can predict when then economy will turn for the worse.
From a technical stand point, spot silver prices are basically trading flat within the said range. A breakout from the range could potentially establish the next leg of direction in the precious metal.
To the downside, a break below $13.88 could trigger sharp selling. This could push silver prices back to $9.85.
Alternately, to the upside, silver prices will be looking at a stiff resistance level of $21.20 – $19.82. This level needs to be cleared in order to establish a strong uptrend.
Investing in silver ETF based on market outlook
At the moment, the silver market along with most other precious metal commodity markets have been trending lower. This is evident from the table below.
TICKER
FUND NAME
1 MONTH
3 MONTH
1 YEAR
5 YEAR
ZSL
ProShares UltraShort Silver
4.54%
4.69%
-3.36%
-7.11%
SLV
iShares Silver Trust
-3.43%
-4.73%
-5.09%
-4.41%
SIL
Global X Silver Miners ETF
-6.29%
-6.78%
-15.68%
-2.89%
USLV
VelocityShares 3X Long Silver ETN
-11.49%
-17.10%
-27.11%
-30.77%
SIVR
ETFS Physical Silver Shares
-3.32%
-4.69%
-4.93%
-4.21%
AGQ
ProShares Ultra Silver
-7.15%
-10.56%
-15.11%
-15.40%
The ETFs have all been yielding negative results. However, you can see that the top of the table, the UltraShort Silver ETFs from ProShares has managed to yield positive returns. This is due to the inverse nature of the ETF.
How to use Silver ETFs as a Hedge?
As a hedging tool, silver ETFs are ideal. It is known that silver alongside gold are considered an effective hedge against inflation.
Most investors also hold the physical bullion as well, despite the higher costs. Holders of silver in the physical form can use the silver ETFs as an effective hedging tool.
When compared to gold, it is important to remember that silver has a higher volatility. So, investors need to be aware of this when using silver ETFs to hedge their portfolio’s exposure.
For investors, silver (alongside gold) makes for good value especially to hedge against the loss of purchasing power in the fiat currency. This was evident in the immediate aftermath of the global financial crisis where central banks across the world started to pump trillions worth of currency into the markets in order to revive their respective economies.
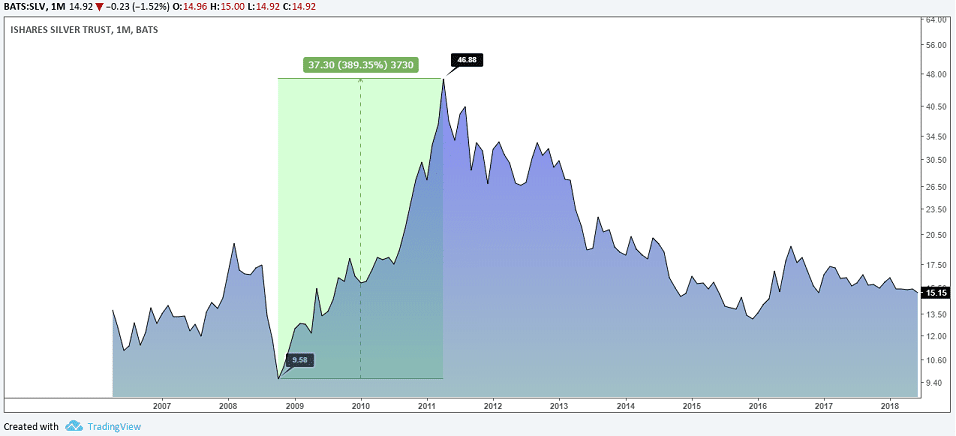
The iShares Silver Trust (SLV) chart illustrates this point very well. After initially bottoming near $9.58, SLV increased 389% in a span of two and a half years.
iShares Silver Trust (SLV) Performance from 2008 – 2011
What to consider when investing in Silver ETFs?
One of the things to consider when investing in silver ETF funds is that the metal is not a foolproof hedge for inflation. This is due to the known fact that silver also has strong use in industrial applications as well.
Therefore, silver tends to fluctuate alongside the economic upturns and downturns of production of goods and services. This is something that is quite unique to silver.
For example, during an economic downturn, the industrial and manufacturing sectors also play a role. Weaker demand could potentially influence the price of silver and thus the silver ETF funds too.
Investing in Silver ETFs – Conclusion
In conclusion, unlike the fiat currency, silver as a commodity is unique and is free from the government’s policies.
Silver might be a poor man’s gold, but at the same time, there are some unique characteristics that also sets it apart from gold as well. Thus, when considering investing in commodity of precious metals ETFs, it is worth considering exploring silver ETFs as an investment vehicle.
Trading liquidity is an important aspect of trading futures, especially if you are a day trader. Trading is already hard of enough endeavor, imagine not getting your fills and dealing with huge bid/ask spreads.
As the old saying goes, there is strength in numbers.
It takes far more money to move a highly liquid contract versus a thinly traded over the counter security.
This high liquidity provides you the investor somewhat of a safety against sharp price movements and market manipulation. Think of liquidity as a sort of insurance policy in the market.
Well in this article, we are going to highlight the 10 most liquid futures contracts around the world.
The chart below shows the top 10 liquid futures contracts by volume across different futures exchanges.
Top 10 Liquid Futures Contracts (Across all exchanges)
If you are looking for the most liquid futures contracts specific to the Chicago Mercantile Exchange (CME), here you go.
Top 10 Liquid Futures Contracts (CME Group)
You may be thinking, why highlight the CME? The simple answer – the CME is a juggernaut and I am from the United States, so I need to understand my local markets.
To this point, I am going to provide a detailed overview of each highly liquid contract. You can use this list as a starting point to determine which contract best meets your trading goals.
1. S&P 500 E-mini (ES)
The S&P500 Emini futures contract attracts an average trading volume of over 1.6 million contracts on any given day.
Without a doubt, the S&P500 E-mini futures contracts stand head and shoulders above the rest.
What makes it attractive to trade are the low day trading margins and tight tick size. Not to mention the S&P500 E-mini futures contracts track the underlying S&P500 stock index thus making it easy for speculators to gain exposure to one of the most popular market indexes.
Ease of Access
Due to the S&P500 pretty much trading around the clock, traders based anywhere around the world are able to trade the contract with ease.
Quarter Tick Size
The small tick size of a quarter point makes it relatively easy for futures day traders to manage their risks with little capital requirements.
Although there is the standard S&P 500 big futures contract, speculators and hedge funds have long flocked to the E-mini futures contract due to the quarter tick.
The S&P500 E-mini contract is also known as one of the most friendly contracts when it comes to technical analysis. You will notice the E-ini contract adheres to key support and resistance levels.
This consistent price movement makes sense due to the low volatility of the broad market mixed with high trading volume.
Once you put these two things together, it generally leads to predictable price patterns.
2. 10 Year T-Notes (ZN)
It is not surprising to find that the 10-year Treasury note futures rank as the number two in the list of the top 10 most liquid futures contracts.
Maturity Sweet Spot
The 10-year Treasury note is in a sweet spot in terms of maturity.
It is not too short and therefore resilient to short-term interest rates and at the same the maturity is not too far out, thus allowing the Note to resist market forces impacting the 30-year.
No Physical Delivery
The 10-year T-Note futures track the underlying cash market of the 10-year Treasury note issued by the U.S. Department of Treasury.
Futures traders who invest in the 10-year T-Note have the option to speculate on interest rates and are able to go long and short with relative ease. The big difference between the underlying cash market and the futures market is the contract can be settled for cash, so there is no physical delivery of the 10-year T-note.
While speculators find it attractive to trade interest rates, traders who have actual exposure to the underlying market can also hedge their risks by trading the futures derivatives contracts of the 10-year T-Note futures.
Low Commissions
The 10-year T-Note futures also come with reasonably low margin requirements for swing traders and the margin requirements for day traders are also very competitive.
3. Crude Oil (CL)
Most Popular Commodity
Crude oil futures come in as the third most liquid futures contract and ranks as the first among the commodity futures contracts.
Crude oil futures are traded at the New York Mercantile Exchange (NYMEX) part of the CME group and the futures contract tracks the underlying market of the light sweet crude oil with the ticker CL.
Note the ICE futures exchange also offers crude oil futures but are different than CL oil futures contract.
Volatility
Having an average daily trading volume of close to 800k, crude oil futures make for an exciting market. Known for its volatility and knee-jerk reactions to news events make crude oil futures an attractive target for traders.
Market participants with exposure to the bond markets will find the 5-year T-Note futures an attractive alternative to the 10-year T-Note futures.
Impact of Federal Reserve
The Federal Reserve’s monetary policies have a big influence on the 5-year T-Note futures like most short-term interest rate or Treasury instruments. The 5-year T-Note futures are offered by the Chicago Board of Options Trade (CBOT) and are standardized.
The face value of the 5-year T-Note futures is $100,000, has four quarterly contract months and trades close to 24/7.
5. Gold (GC)
Gold futures contracts are the fifth most liquid futures contract and rank second among commodity futures. The contract tracks the underlying spot gold markets and the futures prices are mark to market on a daily basis.
Gold futures have an average daily volume of over 300k and are offered by COMEX, part of the CME group.
Most of the gold futures contracts are made up of speculators who by and large do not have any interest in taking delivery of the physical metal. There are many different versions of gold futures contracts including micro or mini contracts; however, the standard gold futures contract is the most popular.
Large Tick Size
The day trading margins for gold are a bit expensive, but that doesn’t deter day traders from trading the standard gold futures contracts. Even with a tick size of $10.00, gold futures are still extremely liquid.
6. EuroFx (6E)
The CME group offers EuroFX futures or simply Euro futures are part of the currency futures class of contracts. The Euro FX futures rank at number 6 overall and first among currency futures.
The Euro Fx futures contracts or Euro/US dollar futures contracts offers traders an attractive futures contract to gain exposure to the 27-nation single currency. The contracts in the Euro/US dollar are extremely liquid and come in notional values of €125,000.
Types of Euro Contracts
There are also other versions of the Euro Fx futures contracts including the E-mini and the E-micro. Still, among the three, the standard euro fx futures contract is the most popular. The Euro Fx futures also come with low day trading margin requirements and for futures traders who prefer to swing trade the contracts; the standard margin requirements are fairly competitive.
The Euro/US dollar futures contracts come in four quarterly cycles and trades almost 24 hours a day. The Euro Fx futures track the prices of the underlying spot EURUSD prices with the contracts being marked-to-market on a daily basis.
7. 30-year T-Bonds (ZB)
(ZB) 30 Year T-Bond futures price chart
The 30-year Treasury bond futures, also known as the T-Bond futures represent the 30-year maturity on interest rates.
The 30-year interest rates are a critical factor for determining key rates such as mortgages.
30-year T-Bond futures were originally launched in 1977 and are one of the widely traded bond futures contracts across speculators, hedge funds and other market participants.
The T-Bond futures traders during three contract month periods of June, September, and December with a contract size of $100,000
8. Japanese Yen (6J)
Japanese yen futures are the second most liquid currency futures contracts and rank number eight overall.
The Japanese yen futures contracts give futures traders the exposure to the third largest economy in the world. The yen futures contracts are the inverse of the spot market prices of USD/JPY.
The yen futures contracts control a contract size of ¥12,500,000 with a tick value of $6.25 and have a minimum tick of 0.0000005.
Key Characteristics
The Japanese yen is known for its unique characteristic as a safe haven currency.
It is not just currency speculators who flock to the yen futures contracts but also traders and investors who have exposure to the equity markets. Lastly, the yen currency tends to appreciate during times of increased uncertainty in the markets.
9. 2-year T-Notes (ZT)
The 2-year Treasury Note futures track the underlying markets of the 2-year T-note bonds. The futures derivatives are offered on the CBOT exchange and a product of the CME group.
The 2-year Treasury note is third among the three interest rate futures derivatives.
The 2-year T-Note futures have quarterly contract months of March, June, September, and December and control a contract size of $200,000 with a minimum tick of 0.0078125 with the dollar value of each tick priced at $15.625.
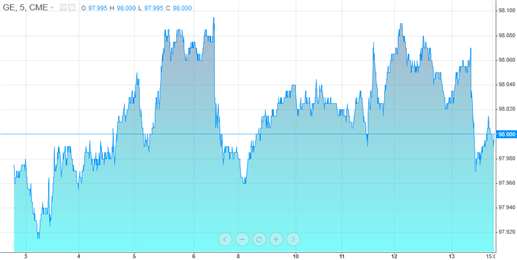
10. Eurodollars (GE)
Eurodollar futures intraday chart
Eurodollars are part of the interest-bearing bank deposits that are denominated in U.S. dollars but held at banks outside the United States.
Some investors confuse Eurodollars with Euro fx futures contracts.
The Eurodollars are attractive for investors due to the fact that they do not fall under the jurisdiction of the Federal Reserve and also come with lower regulations. As a result, the high level of risk makes it attractive for investors, especially those who seek higher yields.
Eurodollar futures are available 10 contract months with a minimum tick size of 0.0025 with a tick value of $6.25.
In Summary
You have a lot of options when it comes to trading futures contracts. Below are a few questions you can ask yourself, which can help with your decision of where to invest.
How much money do you have to invest? Some of the contracts require a larger upfront investment, while others have a low barrier to entry.
What is your local market? This is not a hard fast requirement, but it’s pretty hard to trade Yen futures if you are asleep.
Do you need to hedge against market volatility? Futures are a great way to hedge against a larger cash position. Assess which futures contract will best protect your portfolio.
![20 Moving Average Pullback Strategy: Great For Short Term Trades [Plus Video Tutorial!]](https://app.tradingsim.com/wp-content/uploads/2021/08/20-Moving-Average-Pullback-Strategy-scaled.jpg)