Nasdaq 100 Futures: 5 Key Facts to Know Before Trading

The Nasdaq 100 futures are part of the index futures contracts offered by the CME Group. They are one of the popular index futures with different versions, but the e-mini Nasdaq 100 futures tops the list in terms of volume and popularity. Similar to the E-mini S&P500 or the $5 Dow futures the Nasdaq 100 futures contract tracks one of the leading stock indexes in the U.S., namely the Nasdaq 100 index.

Compared to the S&P500 e-mini (ES) index futures contracts, the e-mini Nasdaq 100 contracts are a bit cheaper when you compare the tick value. For example, a 0.25 index point move in S&P500 is valued at $12.50, while the tick value for the e-mini Nasdaq 100 contract is $5.00. The Nasdaq 100 futures contracts also exhibit some characteristics which sets it apart from the other index futures contracts.

Besides some fundamental and technical differences, the Nasdaq 100 futures contracts allows day traders and investors to trade the contracts with relative ease, either for speculative purposes or to hedge the risks from the underlying market. The Nasdaq 100 futures contracts are all financially settled and there is no physical delivery of the underlying asset.

(NQ) – The Nasdaq 100 Futures Price Chart

Besides futures, traders can also gain exposure to the underlying market via options contracts as well. Although the Nasdaq 100 futures contracts might look similar to other index futures contracts, there are some subtle differences that set it apart. Before you trade, here are five things every day trader should know before you start trading the Nasdaq 100 futures contracts.

1. The Nasdaq 100 Index

The Nasdaq 100 futures contract is the derivative instrument tracking the prices of the underlying asset, the Nasdaq 100 stock index. The Nasdaq stock index is made up of 107 companies and not 100. Interestingly, the financial companies are excluded from the Nasdaq 100 index making it unique from the Dow Jones or the S&P500 Index. The Nasdaq 100 index’s components are based on a capitalized weighted index.

The Nasdaq 100 index is relatively newer compared to the Dow Jones or the S&P500 index, but the Nasdaq exchange itself is the second largest in the world and is owned by Nasdaq Inc. which  was founded in 1971. Nasdaq is an abbreviation for “National Association of Securities Dealers Automated Quotations.

The Nasdaq 100 was launched in 1985 with a base price of 250 and had to be reset a few times early on. Besides the futures, traders can gain exposure to the Nasdaq 100 by trading the ETF equivalent such as the PowerShares QQQ ETF and of course options.

Prior to 1985 when the Nasdaq 100 index was launched, the exchange itself was referred to as over-the-counter. However the exchange managed to attract high growth companies such as Microsoft, Apple, Cisco, Oracle and Dell, modernizing the way IPO’s were floated.

The Nasdaq 100 index is not to be confused with the Nasdaq composite index. The main difference between the Nasdaq 100 and the Nasdaq composite index is that the latter tracks all the companies listed on the Nasdaq stock exchange, whereas, the Nasdaq 100 tracks only the top 107 companies listed on the stock exchange on the basis of market capitalization. The Nasdaq also has other indexes such as the Nasdaq 100 financial index which specifically tracks the financial sector companies based on market capitalization.

The major distinction though is that the Nasdaq 100 is a sub-index of the Nasdaq composite and they also have different tickers. The Nasdaq composite has the symbol ^IXIC, while the Nasdaq 100 has the ticker ^NDX. The futures contract for Nasdaq 100, tracks the prices of the Nasdaq 100 from the underlying cash markets.

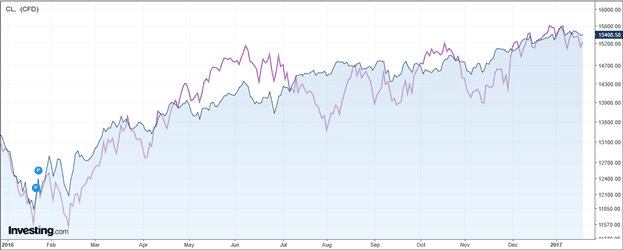
The chart below shows a comparison of the Nasdaq 100 and the Nasdaq composite index. You can see that there is only a small difference in the pricing between these two indexes while the dips and rallies are almost identical.

Nasdaq 100 (NDX) and Nasdaq Composite (IXIC) index

2. The different types Nasdaq 100 futures that you can trade

When you talk about the Nasdaq 100 futures market, the E-mini Nasdaq contract often comes to mind. There are many other contracts that futures traders can choose from, including a Nasdaq Biotech futures contracts as well as the standard or big Nasdaq 100 futures contracts.

Here is a quick overview on the different Nasdaq contracts that you can trade.

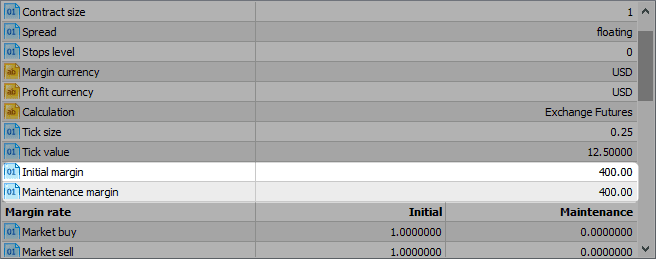
The e-mini Nasdaq 100 futures contracts are no doubt the most popular. These contracts trade with the ticker NQ and the margin requirements are the lowest, enabling many day traders to choose NQ contracts over others. In terms of tick size, The E-mini Nasdaq 100 futures contracts have a minimum tick of 0.25 index points, priced at $5.00 per tick. The day trading margin for the e-mini Nasdaq100 futures contracts are just around $1000 and vary from one futures broker to another. The CME requirements are however $3500 for the performance bond and $2800 for the maintenance margin.

The next most popular contract is the standard E-mini Nasdaq futures contracts. These contracts trade under the ticker QCN. They are almost similar to the E-mini Nasdaq 100 (NQ) but differ in terms of the tick size and value. The QCN Nasdaq 100 contracts are double the E-mini, meaning that the minimum tick size of 0.50 index points with a value of $10.00 per tick.

Due to the higher tick size and tick value, the performance bond requirement from CME group is about $4000 and maintenance margin of $3200.

The big Nasdaq 100 futures contracts are definitely not popular among retail day traders. As the name suggests, these are large contracts and more suited for institutional or hedge fund traders. Trading under the ticker of ND, these large Nasdaq 100 futures contracts have a minimum tick size of 0.25 index points valued at $25.00. The CME Group’s margin requirements are $17,500 in performance bond and $14,000 in maintenance margins.

Finally, there is the specialized Biotech futures contract called the E-mini Nasdaq Biotechnology futures contracts. Trading with the ticker symbol of BIO (Globex), these futures contracts track the Nasdaq Biotechnology index (IBB). The tick size for the Nasdaq Biotech futures are 0.10 index points valued at $5.00. The performance margin from CME Group is $3750 with a maintenance margin of $3000.

3. The E-Mini Nasdaq 100 Futures are the most popular contracts

For day traders, the E-mini Nasdaq 100 futures (NQ) futures are the most popular and attract the highest volume of trading. This level of engagement with the Nasdaq futures contracts means that the contracts are very liquid making it easy to buy/sell without influencing the prices.

E-mini Nasdaq 100 Futures average daily trading volume

Volume in the E-mini Nasdaq 100 futures picks up during the start of the official U.S. trading hours and quite often leads to strong price action in the opening hours of the session. Many retail day traders tend to use this volatility to trade the Nasdaq 100 futures during the first hour of the U.S. trading session to capture profits with only little efforts.

As with all index futures, the Nasdaq 100 contracts are available on a quarterly basis with March, June, September and December contract months. Traders should be aware of the quadruple witching days which occurs four times a year on the quarterly expiration of the derivatives contracts and can bring undue volatility to the futures markets.

Below is a summary of the Nasdaq 100 e-mini futures contracts.

Contract Unit $20 x NASDAQ-100 Index
Trading Hours Sunday – Friday 5:00 p.m. – 4:00 p.m. CT with a 15-minute trading halt Monday – Friday 3:15 p.m. – 3:30 p.m. CT and a 60-minute break each day beginning at 4:00 p.m.
Product Code CME Globex: NQ
Listed Contracts Five months in the March Quarterly Cycle (Mar, Jun, Sep, Dec)
Min. Tick 0.25 Index points
Tick Value $5.00

4. E-Mini Nasdaq 100 futures have a tax benefit advantage over tech stocks or ETF’s

Futures have a tremendous tax benefits compared to stocks or even ETF’s, which are designed to be tax efficient in the long term. Besides the inherent tax advantage, as a futures trader you are not bound by the rules such as the day trading rules which apply to other markets and more importantly you don’t have to maintain the minimum $25,000 in your account for day trading purposes.

In fact this is one of the reasons why Nasdaq 100 futures are more attractive compared to trading the equivalent tech stocks or even tech ETF’s. With the Nasdaq 100 futures, you can easily go long and short on the futures contracts with no restrictions or any additional margin requirements beyond what is required.

The day trading margins for Nasdaq 100 futures are cheap and even for swing traders who want to trade the futures positions overnight, the maintenance margins are very small compared to stocks or ETF trading. The low capital requirements and the fact that futures contracts are leveraged, makes Nasdaq futures one of the best ways for traders to gain exposure to the technology and growth stocks which can yield tremendous gains in a relatively short period of time.

Given the different tax structure for the futures markets, day traders can find that trading the futures markets is a lot more beneficial than compared to stocks or ETF’s, which in any case are more cumbersome and comes with the risk of getting improper fills in the market. The fact that the futures markets trade round the clock makes it appealing for day traders from around the globe and not just U.S. based traders. This almost round the clock trading time ensures that traders can capitalize on any events that happen outside of the U.S. trading hours. Of course while liquidity might not be that high, the fact that traders are able to place trades without affecting the market too much is in itself an advantage.

5. Factors that influence Nasdaq 100 prices

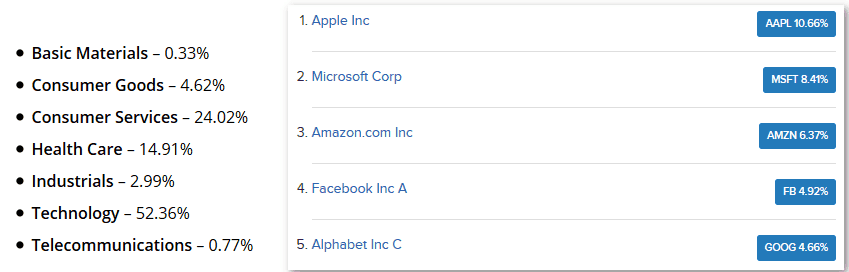
The Nasdaq 100 index is made up technology and bio-technology stocks, and excludes financials. Some of the stocks listed in the Nasdaq 100 stock index are also included on the Dow Jones and the S&P500 Index. However, due to the exclusion of financial stocks, such stocks which are part of the Dow and the S&P500 (ex: JP Morgan, Goldman Sachs) are not listed on the Nasdaq 100 exchange. As a result, the Nasdaq 100 is usually not bothered by the volatility in the financial sectors.

Nasdaq 100 Sector Weightage and Top 5 Companies

When trading Nasdaq 100 futures, traders should pay attention to earnings reports from the company listed and general industry trends. Among the 107 components of the Nasdaq 100, the top five companies are Apple, Microsoft, Amazon, Facebook and Alphabet.

The index is of course subject to volatility from the broader economic factor such as interest rates, monetary policy and other general economic indicators, but the effects are limited. Because interest rates have a direct influence on the financial sector, the Nasdaq 100 index tends to weather any adverse news on interest rates better than its peers. Because technology and biotechnology are two fast moving industries, one can expect to see a lot of volatility represented in the Nasdaq 100 as a result.

Still, when trading Nasdaq 100 futures, traders should focus on the general markers such as the company earnings, the economic factors in the U.S. as well any outliers that could influence investors’ risk sentiment.

The Nasdaq 100 futures contracts might not be as popular as the E-mini S&P500 futures contracts or even the $5 Dow futures contracts. But the Nasdaq 100 contracts offer something unique for the futures trader who wants to trade these contracts for purposes other than hedging their exposure. Due to the fact that the Nasdaq 100 futures contract does not account for any financial stocks, the underlying market can be quite unique to the Dow or the S&P500; this allows traders to look at various ways to spread their risks across the other two stock index futures which behave almost similarly.

The Toronto Composite index or TSX for short is also known as the S&P/TSX composite index. It is a benchmark for the performance of the equity markets in Canada. A composite index is a group of equities clubbed together to provide statistical measure of the market performance over time.

The composite index (S&P/TSX) is used to track the overall price changes in the equity markets in Canada among a select list of companies and is therefore used as a benchmark for the overall performance of the stock market and for individual equity portfolios as well.

Typically, the goal of an equity portfolio or a hedge fund is to outperform the main composite index such as the S&P/TSX index. Although the composite index doesn’t cover the entire market, the selection criteria play a big role. It is often used as measure of the overall equity market performance of the economy or the country where the stock index is based.

Toronto Stock Exchange (TSX) Index

Because Canada and the U.S. are two major advanced economies and the fact that they are next to each other makes both the nations close trading partners. As a result, the monetary and fiscal policies as well as the strength and the weakness of one economy are often felt in the other. It is almost the same story when comparing the TSX and the S&P500, which are the two major benchmark stock indexes for Canada and the U.S. There are many different versions of both the TSX and the S&P500. For example you can trade the ETF versions, as well as the futures derivatives versions of the same product. Regardless of what type of market, all the versions of the TSX and the S&P500 track the price of the underlying cash market.

The S&P/TSX stock index is a float adjusted market capitalization index. A company that is listed on the TSX index has a float adjusted market capitalization which is calculated by removing the control blocks of 10% or more. In comparison, the S&P500 is a market capitalized stock index. In both the indexes, the criterion to add or exclude a stock listing depends at the sole discretion of Standard and Poors.

Overview of the TSX Composite Index

Stock trading in Canada dates back to the 1950’s when the Toronto Stock Exchange was created in 1952. At the origin, only 18 stocks were traded on the exchange and by 1977, things began to change with the advent of Computer Assisted Trading System (CATS). In fact the Toronto Stock Exchange was the first to introduce computer assisted trading besides introducing the decimal system for the stock index at a time when fractional pricing was used across other major exchanges in the world.

The TSX (Toronto Stock Exchange) covers ten business sectors in Canada which are: Utilities, telecommunications, materials, IT, industrials, healthcare, financials, energy, consumer staples and consumer discretionary.

The S&P/TSX originally comprised of about 300 top Canadian stocks but the number of stocks in the index varied over the years. The TSX Index originally started out as TSE300 and had 300 companies listed in the stock index with a yearly review where the listings could be changed. This was back in 1977.

By 2002, the TSX composite index was contracted to the Standard and Poors in the US which eventually saw the TSE300 being closed and gave rise to the S&P/TSX Composite index on May 1st 2002. The changes also saw the index’s structure and other aspects being overhauled as well, including the construction of the index and the management. New rules were introduced for stocks to be included in the S&P/TSX index and number of the stock market sectors were brought down to the ten sectors listed earlier from the previous 14.

As the picture shows below, financials have the highest weightage on the TSX stock index followed by energy, where Crude oil forms an integral part which is a key export product for the Canadian economy.

TSX Futures – Sector Breakdown (Source - TMXMoney.com)
TSX Futures – Sector Breakdown (Source – TMXMoney.com)

Unlike the TSE300 which was reviewed once a year, the new S&P/TSX index was reviewed every quarter and at the discretion of Standard and Poors. The index can be adjusted at any of the quarterly reviews with the consent of the seven members making up the S&P/TSX index committee. One of the biggest factors that make the TSX unique over other global stock indexes was the fact that the number of companies in the stock index varied.

For example in one year, it could have contained 269 companies, while the next year, the number of companies could be dropped to just 204. For example in 2005 and 2011, the S&P/TSX excluded tech stocks which were not performing so well.

These erratic changes to the TSX stock index made it somewhat volatile and hard to track over the longer periods of time. The TSX Composite index now comprises of 249 companies. Some of the well known companies listed on the TSX include: Air Canada, Barrick Gold and Bank of Montreal to name a few.

TSX Futures Contracts

The SXF futures track the underlying cash market of the S&P/TSX60 stock index which represents the leading companies across the ten different sectors. The TSX Futures are only offered on the Montreal Exchange which is the primary futures trading exchange of the Canadian derivates markets. In comparison, the S&P500 futures are traded on the CME Group futures exchange.

The SXF futures come with a multiplier of C$ 200 times the S&P/TSX60 index futures contract value. Similar to other equity index futures, the SXF contracts come in quarterly expiring contracts, for March, June, September and December.

SXF futures prices are quoted in index points and expressed in up to two decimals. The minimum index point move is 0.10 point and the futures contracts are settled for cash. All SXF contracts are cleared by the Canadian derivatives clearing corporation. Besides the SXF, there are other versions of the TSX futures contracts including the emini versions of the contracts as well. A major distinction here is that the TSX futures track the TSX60 market and not the main stock index which tracks close to 300 companies.

The chart below shows the SXF futures price chart.

TSX Futures Price chart (SXF futures)

TSX Futures and the S&P500 Futures Correlation

When talking about the correlation between two stock indexes from two different economies, one way to look at it is to compare how the indexes performed during key economic events. For example, the stock market crash of 1929 did not have any significant impact on the Canadian markets and thus on the TSX. While on the contrary, in the U.S. over 2000 investment and brokerage firms went bust.

However, bear in mind that the TSX has undergone a lot of changes over the years. For example, the TSX used to have some level of correlation to the U.S. Dow Jones Index when the TSX was tracking over 300 companies at one point. The market crash of 1987 for example was different as the TSX also fell sharply following the trends exhibited in the U.S. counterparts such as the Dow Jones and the S&P500.

The TSX futures and theS&P500 futures contracts show a fairly high level of correlation. Because of the fact that both the stock indexes are one of the major benchmark indexes of the U.S. and Canada, the respective equity indexes tend to exhibit a certain level of similarity.

While it is difficult to determine the correlation between the futures markets, the ETF version of the TSX and the S&P500 shows that both these indexes have a correlation of 0.78 as shown in the picture below.

Correlation between TSX and S&P500 ETF’s (source - Portfoliovisualizer.com)
Correlation between TSX and S&P500 ETF’s (source – Portfoliovisualizer.com)

Although the ETF’s are different markets, the correlation between the S&P500 and the TSX60 ETF shows that a similar correlation exists in the futures markets as well. In terms of confidence, the data shows that there is a 90% confidence that both the markets move in the same direction. Generally a correlation of 1 or positive correlation indicates that two markets are nearly identical in their behavior and tend to exhibit the same characteristics such as prices moving at nearly the same rate. A correlation of around 0.90 indicates a near certain movement in both the assets, but not exactly on a 1:1 basis. Overall, a correlation of 0.80 and above is said to be very strong, while a correlation of 0.70 – 0.80 is said to be strong.

Therefore the correlation of 0.78, between the TSX and the S&P500 ETF markets suggests that there exists a similar level of correlation in the futures markets as well.

Besides the rather strong correlation, the TSX and the S&P500 markets are strongly interlinked due to the level of trade and interdependence between the two economies in question. While global factors that hit market sentiment such as political uncertainty in some region or other similar events tend to affect the global stock market indexes on the same level, other domestic factors that influence the index independently of each other exists.

The health of the U.S. economy also plays a big role in impacting the index performance for the TSX. For example a weaker economy would infer that the pace of exports from Canada will slow, likewise a healthy U.S. economy bodes well for Canada which translates to higher export volumes. Similarly, the U.S. dollar’s exchange rate is also an important factor in influencing the exports and imports, all of which tend to eventually affect the respective economy’s stock markets.

When comparing the TSX and the S&P500 stock index, it is important to also pay attention to the monetary policies from the Bank of Canada and the U.S. Federal Reserve. The BoC often lags behind the Federal Reserve, meaning that when the U.S. is in a rate hike cycle, you can expect to see Canada’s interest rates start to rise as well, and vice versa, lagging over a few quarters.

For example, the TSX also tends to closely follow the oil prices as well. Because Oil is a big export product from Canada, the index has lot of companies that have exposure to crude oil, which tends to affect the stock index on the whole.

The chart below shows the Crude oil prices and the TSX index compared together.

TSX and Crude Oil prices comparison

On the other hand, the impact of Crude oil prices on the S&P500 stock index is more limited as the stock index contains a wider set of industries than compared to the TSX index. Still with a correlation factor of 0.78, it is safe to suffice that the TSX and S&P500 futures markets are correlated. Although, having said that day traders should be looking at both the markets independently before taking up any traders with the correlation coming in only as a confirmation of the market bias.

When two assets are strongly correlated, it highlights the fact that traders who have exposure to both the markets are less diversified and therefore increases the risk to the downside. For traders, it is essential to understand how the markets interact under different market conditions. Correlations are never set in stone and tend to change over a period of time. Therefore, traders need to be aware of the current market drivers along with having an eye on the short term and the long term outlook off the markets in question.

One way to ascertain the level of correlation and the various periods is to watch how the markets react over a period of time which underlines the importance of paying attention to risk and diversification. A good example of this is the way the TSX had little impact during the 1929 crash, but the index also took a hit during the 1987 crash. This indicates that traders cannot afford to be complacent when comparing two different stock indexes. The correlation of 0.78 today could easily be higher or lower in a few months time and the major constant being the short term market drivers that can influence the correlation. It can come in different ways, from oil prices to inflation to monetary policy to an outperformance of an underperformance of a particular sector.

Day Trading E-Mini Futures with Moving Averages

Moving averages are one of the simplest and universal technical analysis indicators that are widely used across different markets and time frames. While the indicator can often be dismissed for its age or its simplicity, the fact that moving averages are widely used in the markets today is perhaps a testament to its importance and relevance in the markets even to this day and age.

The moving average indicator finds its roots from math, which has been an important element in technical analysis in the financial markets. Initially, the moving average that was used in the markets was a simple arithmetic average of prices. It was simple and quick to calculate, making this rather simplistic approach to technical analysis stand out from the rest.

The moving average was and still is, in fact a technician’s best friend since the days of charting by hand. As technology evolved and computers took over, the simple and trusty moving average has managed to evolve into the many different versions of moving averages that we come across today.

Still, despite the many forms of moving averages, the simple moving average and the exponential moving average are probably the two most widely used technical analysis indicators. It is not surprising to see the moving average indicators form the basis of many technical trading systems while at the same time adorning the screens of a professional trader talking on main stream financial media.

It is probably the simplistic nature of moving average that has made it one of the most widely accepted and used technical analysis indicator used in stocks, futures, forex and even bonds. Any beginner to trading and technical analysis would have no doubt stumbled upon moving average as one of the most basic of technical trading tools that they can use.

When using the term average, mathematically, it is referred to as the arithmetic mean or arithmetic average. It is a very basic statistical measure and providers a quick and easy way to find general level of values in a data set. Calculating the arithmetic average is quite simple, it is a sum of all the values in the data set is divided by the sum of the number of values.

Types of Moving Averages – Brief Introduction

Moving averages are primarily classified into the following types, which are the most commonly used types of moving averages.

  1. Simple moving average
  2. Exponential moving average
  3. Linear weighted moving average
  4. Smoothed moving average

Among these four, the simple moving average and the exponential moving averages are the more commonly used types of moving averages.

A simple moving average, as the name suggests is a very basic statistical measure and provides a quick and easy way to find general level of values in a data set. Calculating the arithmetic average is quite simple. The sum of all the values in the data set is divided by the sum of the number of values.

Calculating the simple moving average (2 period close)

The Simple moving average is still one of the most widely trusted technical analysis indicator with many professional traders keeping an eye on the 200 day Simple Moving Average, also called the 200-day moving average. The 200-day MA is importance simply because it is one of the widely used periods on the simple moving average on a daily chart with many mechanical trading systems and algos built around price and the 200-day MA. Other most commonly used settings for the moving averages include, 100, 50, 20, 10 with some specific settings such as 21, 34 and 55. Despite the wide range of look back periods traders should note that there is no “perfect setting for moving averages”. At the end of the day, it comes down to how well a trader can understand price, the markets and the moving averages that are used on the chart.

The flexibility of the moving average comes from the fact that the technical indicator can be used on any instrument and across any time frame, start from the 1-minute chart to the monthly charts. Every day trader has their own preference on the look back period of the moving average with some arguing that their look back period of the MA being superior to other. The moving average indicator is also used on other custom or time independent charts such as Renko or Point and Figure charts where only price is the variable on the chart.

The exponential moving average is another alternative to the simple moving average. The main difference between the two, being that the exponential moving average tends to be more receptive to the latest prices than the simple moving average which treats all values in the data set equally.

The reasoning behind this stems from the fact that an exponential moving average gives more weightage to the most recent prices in the data set thus making the moving average more sensitive to the current data. When comparing the simple moving average to the exponential moving average you can see how the EMA is more sensitive to price than the SMA.

Comparison of 50 period SMA (Black) and EMA (Red)

In the above chart the Red line shows the 50-period exponential moving average and the Black line shows the 50-period simple moving average. On a normal chart (no gaps or volatile price movements), both the EMA’s tend to print nearly similar prices. However, once you factor in volatility such as price gaps, sharp movements in prices, the SMA and EMA start to diverge. While the SMA continues to print a steady moving average line, the exponential moving average becomes more sensitive to prices and as a result the EMA also shows volatility in the average prices that are plotted.

While there is no answer to whether the simple moving average or the exponential moving average is better, traders need to apply the respective moving average depending on the instrument and the market that they are trading. For example, a steady trending market on a daily chart can be better used for the simple moving average while a more volatile intraday trading would see the exponential moving average offering better insights to the day trader.

When traders make use of two moving averages, the crossovers off the short term and the long term moving averages can signal bullish or bearish trends.

Typically, when a short term moving average crosses below the long term moving average, it is known as the Death Cross. Grim as it sounds, the death cross of a 200 and 50 moving average for example merely denotes a bearish trend in the markets. Likewise, when the smaller moving average crosses above the long term moving average, it is known as the Golden Cross which signals a bullish trend that is evolving in the markets. The Death Cross and the Golden Cross are two terms that are often used in the main stream media especially for the equity markets and thus is quite relevant to the futures markets.

Traders typically make use of two or more moving averages in order to determine the trends in the market. This is done by using a shorter period moving average and a longer period moving average.

The 10 period and 20 period Exponential Moving Average

Among the different periods for the exponential moving average, the 10 and 20 period EMA’s are the most common. The values simply represent the recent 10 or 20 prices (open, close, high or low) on the price chart. When applied to the daily time frame, the 10 and 20 periods EMA simply show the monthly and half monthly average prices.

It can also be used on 1-hour chart and can depict the short term intraday trends in the market.

10 period and 20-period EMA on daily chart

The above chart shows how a combination of the 10 and 20 period EMA results in the price trend being defined clearly. The bullish crossover on 9th November, where the 10 period EMA crossed above the 20 period EMA resulted in strong trending markets validated by the short term EMA staying above the long term EMA.

The 10 and 20 period exponential moving averages are one of the most commonly used technical analysis indicators for trading the emini futures contracts such as the Dow (YM), S&P500 (ES), Nasdaq (NQ) to name a few. Using the two moving averages, traders can use the indicators to swing trade or day trade the futures markets. Due to the simplicity of the moving averages, there are many mechanical, discretionary as well as high speed algorithms that are built revolving around the moving averages and the price.

Besides being used a trend indicator, the moving averages can also serve the purpose of identifying potential support and resistance levels in price. When a trader can find such levels and combining this information with the moving average, a simple yet robust trading system can be formed.

10,20 EMA on Emini futures (Support-Resistance)

The above chart shows one of the ways the moving average indicators can be used. Starting from the left, you can notice the resistance level that was formed by a bearish reversal in prices within the downtrend indicated by the 10EMA trading below the 20EMA. Few sessions later, the 10EMA rises above the 20EMA to signal bullish sentiment in the emini futures market. After a brief rally, price pulls back right to the previously identified resistance level when support is formed. This is also marked by the doji candlestick pattern and a bullish candlestick there after indicating a bullish continuation in prices.

Following the bounce off this old resistance forming to new support, price makes another attempt to rally before starting to slip back. You will also notice how in the few sessions later, price posts another reversal but with a lot more volatility near this identified level.

The above example illustrates just one of the many ways futures day traders can use the exponential moving average to day-trade the emini futures markets. Here’s a brief bullet list of some of the ways traders can use the moving average indicators.

  • 10/20 EMA bullish and bearish crossover signals
  • Buying dips in an uptrend or selling rallies in a downtrend
  • Divergence based set ups
  • Finding support and resistance levels using price reversals and trends depicted by the EMA’s
  • Identifying strong momentum based on the slope of the short term moving average in relation to the long term moving average
  • Building a moving average envelope of high and low prices to identify breakouts from the average trending prices

The different types of uses for the moving averages have made it one of the cornerstones of many trend following strategies. Typically, moving averages are also used alongside technical oscillators such as the Relative Strength Index (RSI), Moving Average Convergence Divergence (MACD) or the Stochastics oscillator, all of which aim to capture the rise and fall in momentum. Combined, the MA’s and the oscillators tend to provide a fairly robust picture of the markets and help in determining to pick the dips and rallies in a trend.

10, 20 Exponential Moving Average with Stochastics Oscillator

To conclude, the moving averages might be easily dismissed by some traders for its simplicity and its antiquity. However, the indicator has stood the test of time and is derived from a simple piece of math and the general logic surrounding it. Now-a-days, there are many different versions of the moving averages which claim to offer something new for traders. It is not surprising to find traders continually look for the latest improvement to the moving average, when the fact remains that the simple and exponential moving averages are probably one of the best indicators out there.

Due to the fact that some EMA and SMA periods such as 200, 100, 50, 20 and 10 are so closely watched by most traders, it has become a self fulfilling prophecy. For day traders who are just getting started, the moving averages (whether you are using the simple moving average or the exponential moving average) are probably one of the best places to start in your technical analysis journey.

One of the benefits of trading futures is the fact that traders can get access to just about any major stock index or an exotic currency in the futures markets, with the benefit of trading on margin or leverage. While Japan’s Nikkei 225 or the London FTSE100 futures are some of the non-American equity index futures markets that one can trade, the NIFTY50 futures makes for an interesting stock index futures to trade.

For futures day traders who are on the lookout of more interesting markets away from the regular ups and down in trading the more popular S&P500, Nasdaq or the Dow emini contracts, the NIFTY50 futures offers just the right level of excitement and variety. If you have traded the U.S. equity indexes and the Japan’s Nikkei225 index futures, there is a certain level of correlation between the index futures price movements. The NIFTY50 index on the other hand behaves a bit differently making it quite unique. Due to India’s position as one of the leading emerging market economies and its position of strength in Asia, the NIFTY50 futures contracts make for a unique trading instrument. Futures traders who like volatility will find trading the NIFTY50 futures contracts to be enjoyable.

The NIFTY50 futures contracts track the prices of the underlying asset which is the NIFTY50 cash markets. Here are seven things a futures trader should know before you start trading the NIFTY50 futures markets.

1. NIFTY50 is one of the leading index for India’s stock markets

NIFTY50 index is the benchmark stock market index for the Indian equity markets on the National Stock Exchange (NSE) and is one of the two main benchmark indexes for the Indian subcontinent. The other main index besides NIFTY50 is the Sensex, used by the Bombay Stock Exchange of BSE, which tracks 30 companies. The NIFTY50 Index was formerly called the S&P CNX Nifty Index until 2013.

NIFTY50 Stock Index Chart

The name is derived from National and 50, which combined becomes NIFTY50. The index is owned and managed by India Index Services and products (IISL). The NIFTY50 is not to be confused by the large cap stocks from the NYSE used in the 60’s and 70’s and included companies such as Disney, Coca-Cola, and Dow Chemicals and so on.

The Nifty50 is a benchmark index for India, which was launched in 1995 and is relatively new. The index tracks 51 companies. The NIFTy50 index is a capitalization weighted index and made up of a wide range of sectors from Pharmaceuticals to Media & Entertainment to IT and Automobiles sectors. Overall, there are 24 sectors that make up the NIFTY50 index. The NIFTY50 index was formed in 1995 with a base value of 1000.

2. NIFTY50 Futures Contract Specifications

The futures ticker symbol for NIFTY50 is MNF on the Globex electronic platform. The NIFTY50 futures contract is priced in U.S. dollars, unlike the NIFTY50 index which is priced in Indian rupees. The contract size is a multiple of $2 times the index value, meaning that if the NIFTY50 index is at 8000, the contract size is $2 times the index or $16,000. The NIFTY50 futures contract is available as e-mini version only and has a minimum tick size of 0.5 index points. Each index point is valued at $1.00

Trading on the NIFTY50 futures contract is the same with trading hours from Monday through Friday, starting from 4pm the previous day through 5pm on the current day with a 1-hour trading break from 8:30 through 9:30 PM.

One of the unique aspects of trading the NIFTY50 futures contract is that similar to the Nikkei futures, the NIFTY50 contracts come under the mutual offset system (MOS). This means that the NIFTY50 futures contracts can be settled either at the CME Group futures exchange or the Singapore Exchange (SGX). A trader can designate a trade as an MOS before execution and then choose whether CME or SGX will carry the position.

Below is a summary of the CME Group’s emini NIFTY50 futures contract specification.

NIFTY50 Futures Contract Specification

3. Low trading volumes and trading hours

The NIFTY50 futures contracts aren’t the most actively traded futures contracts. On average the volume on NIFTY50 futures are around 600 – 800 contracts. It is normal for the NIFTY50 futures contract to see low volumes on most days in only double digits. This lack of sufficient trading volumes can pose a risk for most futures day traders and a large volume of orders can significantly move the prices.

NIFTY50 Trading Volumes

Due to the low volumes, not all retail futures brokers list the NIFTY50 futures contracts and therefore futures day traders who want to trade specifically the NIFTY50 futures will need to shop around for the futures broker that offers trading the NIFTY50 futures contracts.

Besides the lower trading volumes, the trading hours on the NIFTY50 futures also plays a big role. The NIFTY50 cash market trades from 9:15AM – 3:30PM on weekdays, which is about 9:45PM through 4AM central time. Therefore, traders based in the U.S. will need to stay awake during the cash market hours where liquidity is higher than usual. The futures markets open 15 minutes before the official cash market open, which is the pre-market trading hours where some amount of liquidity can be seen.

4. NIFTY50 Futures intraday trading strategies

Due to the fact that the NIFTY50 tracks the 50 (51) large cap stocks in the Indian stock market it is one of the sophisticated index for trading a basket of stocks. Due to the fact that no individual stock can influence the index significantly, it is easier to trade the NIFTY50 based on technical analysis alone, similar to trading the emini S&P500 futures or the emini Dow contracts. However,  as mentioned in the previous item, day traders need to ensure that they trade during times of sufficient liquidity and trade during the cash market hours in order to avoid being trapped into a position on low volume, which can then turn risky as volumes dies out as the cash market closes.

There are many technical strategies that have stood the test of time on the NIFTY50 futures price charts. Day traders can start with the most basic, moving average crossover, or trading the first trading hour of the NIFTY cash markets in order to day trade for a few points. The day trading futures margins for the NIFTY50 contracts are usually around $200 – $500 making it a lot more affordable to trade on lower capital.

5. CME NIFTY50 futures, not to be confused with the local NIFTY futures

While the CME futures offers the NIFTY50 futures contracts, these are not to be confused with the NIFTY futures contracts offered on the National Stock Exchange. The main difference between the local NIFTY futures contracts and those offered by the CME Group is the contract size, value and the pricing itself. For example, the local NIFTY futures contracts have a contract size of 25 units with the contract value being a multiple of the contract size (25 times index value in Indian rupees).

Besides these primarily differences, the local NIFTY50 futures trade in a same way, meaning the prices are marked to market on a daily basis and trading the NIFTY futures is done on margin.

6. Factors that affect valuation in the cash markets

Trading the NIFTY50 futures, although technical, still requires traders to keep an eye out on the fundamentals. However, the fundamentals that govern the NIFTY50 stock index which is the underlying market is usually a bit different than compared to trading the actual stocks. Broadly put, fundamentals such as inflation, GDP play a major role in determining the momentum in the stock index. Unlike the advanced economies where interest rates are close to zero and seldom move twice during a year, emerging economies have different dynamics in play.

Interest rates can be changed, sometimes with warning and sometimes coming as a surprise to market participants which eventually tends to influence prices of the NIFTY50 index quite adversely.

Besides monetary policy, there are also geo-political and other risks that are common to emerging markets such as India. For example, the most recent case of demonetization, which took the Indian markets and the world by surprise led to a 4.3% decline on the NIFTY50 index on a single day.

While technical analysis can help, totally unforeseen events such as these tend to play havoc on the markets and something that futures day traders need to keep an eye on. It can be a bit difficult especially due to the time zones and the market hours.

7. Influence of the U.S. dollar’s exchange rate

The U.S. dollar’s exchange rate also plays a major role when it comes to influencing the price of the NIFTY50 index. Although the USDINR exchange rate is not one that is widely used, the exchange rate plays a crucial role for sectors such as Information Technology and other companies that are used as outsource hubs. Typically a stronger Indian rupee tends to eat into the profit margins for the services export oriented companies while a weaker Indian rupee tends to have a positive impact.

Although no each company listed on the NIFTY50 index has a single highest weightage which tends to balance the risks on the index, keeping track of the exchange rate for USDINR is important if you want to trade the NIFTY50 futures in the long term.

Besides the monetary policies from the U.S. that affect the dollar, NIFTY50 futures day traders should also focus on monetary policies from India’s Reserve Bank as well which. Bear in mind that USDINR does not attract high volumes despite the Indian rupee being a free floating exchange rate.

The chart below shows the overlay of the USDINR exchange rate (white line) and the NIFTY50 cash market index.

NIFTY50 Cash Market Index (Right) and USDINR (Left)

In conclusion, the NIFTY50 futures contracts are one of the more exotic futures contracts which track the NIFTY50 cash markets from India’s National Stock Exchange. Due to the fact that the NIFTY50 futures contracts are exotic, the trading volumes are typically lower, meaning that futures day traders need to be very cautious in order not to get trapped by illiquid market conditions.

Another major factor to consider when trading the NIFTY50 futures contract is the timing of the actual market hours. Whatever little volume one gets to see on the NIFTY50 emini contracts are during the cash market trading hours which is closer to 9:45PM central time thus putting the contract out of reach for most traders in other time zones.

The concept of margin or margin trading is of utmost importance in the trading community, including futures and other derivatives markets spanning across different asset classes. Margin, in futures trading is basically a deposit made in good faith with the broker. It is nothing but the capital required to post or known as the deposit collateral required to control positions in a futures contract that you want to trade.

To put it another way, margin is a partial down payment required by the futures exchange on the full contract value of the futures contract that you are trading.

How much of this down payment you make, is determined by the futures exchange which sets the margin rates. Of course, depending on the retail futures broker that you trade with, the margin requirements can significantly differ from the margin requirements from the futures exchange. The amounts also change when you are swing trading the futures markets or just day trading.

There are instances where a futures brokerage can add some premium on top of the margin requirements set by the futures exchange in order to lower the customer’s exposure to risk.

Typically, the day trading positions are a lot less than compared to swing trading positions in the futures markets. For example, in order to day trade an e-mini S&P500 futures contract, the day trading margin ranges between $400 – $500 (as long as you close the position by or before the end of day).

When trading futures, it is very important that you understand the concept of margin and the implications on the e-mini futures contracts or just about any other futures contracts that you would trade.

#1. Margin is based on market volatility

Margin, in the futures markets is not fixed and can vary depending on the market volatility. However, margins do not change on a day to day basis but is monitored periodically. When market volatility or price deviation starts to increase steadily over a period of time, it can often result to increase in margin requirements from the exchange and/or from your futures broker.

Historical margin requirement changes (Source - CME Group)
Historical margin requirement changes (Source – CME Group)

Any changes in the margin is well communicated ahead of time and do not change overnight. However, it is prudent that the futures day trader keeps track on any margin changes requirements either from the exchange or with the retail futures brokerage that they trade with.

Futures exchanges can also increase margin requirements ahead of time in anticipation of key market events that can influence the volatility which results in a change in margin requirements by the retail futures brokerages as well.

The margin requirements change in response to events such as:

  • Changing volatility
  • Shifts in supply and demand
  • Changes in fiscal policy
  • Major geopolitical events
  • Natural disasters

#2. Initial margin and maintenance margin

Every futures position requires an initial margin known as a performance bond. This is the collateral that is paid to the broker or the exchange by the market participants. The initial margin or performance bond can vary from one futures contract to another and the amount of margin requirement can also change based on various market conditions described in the previous point.

Besides the initial margin, futures traders also need to post a maintenance margin. This is applicable for swing traders in the futures markets. Because futures prices are marked-to-market on a daily basis, any profits or losses made from the time of opening a futures contract to the end of day price is marked automatically. Therefore, a maintenance margin is a requirement especially for those who keep their futures trading positions open overnight. Any profit or losses are automatically added to or subtracted from the maintenance margin.

Hypothetically speaking, if the initial margin on a corn futures contract is $1,000 and the maintenance margin is $700. The purchase of a corn futures contract requires $1,000 in initial margin or performance bond. After you open a position in corn futures, if the price of corn falls by 7 cents, or $350, an additional $350 in margin must be posted to bring the level back to the initial level.

The initial margin and maintenance margin are both unique to the futures markets, which is something every trader should know.

#3. Margin Call

When the maintenance margin falls below a certain level, the exchange or the futures broker can make a margin call, where in the futures trader will have to fund their account. Failure to do so could result in the position being liquidated.

A margin call is defined as when the value of your futures trading account is lower than the maintenance level. When this happens, it results in a margin call, typically the broker calling you to inform you about the fall in your margin and thus asking you to fund your account. Margin call now a days in electronic is mostly done by email alerts or SMS alerts.

To understand margin call, take the following example. You are currently trading five futures contracts for some market. This required you to post a performance bond or an initial margin of $10,000, while having to maintain $7,000 in maintenance margin in you trading account.

Now, when the total value of your trading account falls to $6,500 a margin call is triggered which will require that you deposit an additional $3,500 to return the account to the initial margin level. Failure to do so would result in automatic closure of the futures trading positions that you held.

#4. Margin requirements for futures changes based on the contracts being traded

As a comparison if you were to trade stocks, then a simpler arrangement would be that equity market participants are required to post a 50% margin. Thus for a starting capital of $100,000, equity traders can trade only up to $50,000 worth of stocks. In the futures markets however, the margin requirements are lower.

For a typical futures contract, the margin requirements can vary from as low as 5% to 15% of the contract’s value. Thus, the margin requirements vary depending on the contract that you are trading. In this aspect, it is easy to see why margin requirements for emini futures contracts are a lot cheaper compared to trading full contracts.

As an example, if you were to trade the standard Gold futures contract, the initial margin requirement is about $1000. However, the e-mini gold futures contract has an initial margin requirement of only $500, or the e-micro gold futures which has an initial margin requirement of just $250.

For day traders this means that sticking to the e-mini or micro futures contracts offers the best chance on account of low margin requirements.

#5. Calculating Futures Margin Requirements

Futures trading exchanges implement margin trading rates based on a program called SPAN. This is an automated program that measures the many different variables at certain periods of time to derive at a final number which is then used as an initial margin and maintenance margin in each of the futures contracts from the exchange. Of the many different variables, volatility in each of the futures markets is the most critical with various futures trading exchanges changing the requirements based on different conditions.

Example SPAN Risk scan (Source - CME Group)
Example SPAN Risk scan (Source – CME Group)

According to the CME group, SPAN is defined as market simulation based “Value at Risk” system which automatically assesses risks in the overall portfolio. The SPAM system allows for effective margin coverage while also ensuring preserving the efficient use of capital. This automated system for risk has been in use since 1988 and is approved by various market regulators and market participants.

For a more technical read up on SPAN, read this PDF document.

#6. Margin trading can be risky

Trading on margin is risky and profitable at the same time. While margin trading can give you the benefit of leverage and thus control large positions with only small collateral if not used wisely, margin trading can lead to significant losses.

Take the example of trading a gold futures contract where each contract is for 100 ounces of gold. With an initial margin of $1000 you can buy one contract of gold at $1270 and sell it at $1275 for a $5 profit. At 100 ounces, this results in $500 profit (not accounting for exchange or brokerage fees).

In terms of the profit made on the trade, that would amount to 50% returns ($500/$1000) on the margin. But in reality if you had actually purchased gold at $1270 and sold at $1250, your return would have been 0.39% ($5/$1270).

As you can see from the above, futures trading on margin can give you high returns, but it also opens the risks of significant losses as well.

Futures tracing exchanges constantly monitor the market risks and change the margin requirements accordingly. Margin, although risk is one of the basic points that holds the futures markets together as it allows the market participants to trade with confidence that all the buyers and sellers will meet their obligations at all times.

#7. Why emini futures contracts are better to trade on margin

By now it is evident that the margin requirements change from one futures contract to another. Furthermore, the large contracts such as the big S&P500 futures, or gold futures contracts attract higher margins. For the futures day trader with deposits of $10,000 or less, it is essential to trade futures contracts that offer a balance of the tick size and the margin and maintenance margin requirements.

In this aspect, the emini futures contracts are best suited. For example the standard S&P500 emini futures contracts have an initial margin requirement of around $400 – $500 with the same amount required as maintenance margin.

Example of emini S&P500 futures contract margin requirements

This amount is already locked in towards margin for trading one contract. You can see that, the more contracts you trade, or different markets that you trade simultaneously, the lower your trading capital becomes as the margin requirement starts to build up, which results in very small breathing space for your trades and heightens the risks of a margin call very quickly and especially when market volatility rises.

By taking a disciplined approach and trading not more than a few number of emini contracts that are manageable, futures day traders can build a disciplined trading approach with good risk management into their trading system. Although the e-mini futures contracts control smaller positions, they can still return fairly decent amount of profits over time, while also ensuring that you can adequately control your trading risks in case a trade moves against your position.

In conclusion, margin is nothing but an initial partial payment on the full value of the contract that you want to trade. Trading on margin allows the exchange or the counter party to become the buyer or the seller on the contracts that you trade. Margin trading guarantees anonymity because the exchange becomes a counter party and thus eliminates any credit risk from the transaction on either ends.

Due to the CFTC regulations, futures exchanges are required to be well capitalized and be liquid in order to meet all obligations. This liquidity comes from the margins that are collected by all market participants in the futures exchange.

Trading on margin is risky as only a small percentage of the total contract value offers a powerful leverage to maintain large positions. While margin trading can offer traders the potential of making big profits, the losses can also be equally devastating. In order to carefully manage margin trading on futures accounts, traders should first have a good starting capital to trade with followed by managing good risk management principles and a trading strategy. For beginners, it is always best to stick to the e-mini or e-micro futures contracts which have the lowest margin requirements thus allowing traders to be able to adequately trade on the emini or emicro futures contracts on leverage and still be able to sufficiently manage risks.

Gap trading can be one of the simplest of technical trading approaches to day trade the futures markets. Gaps are a common phenomenon in the stock markets where the pre-market and after hours markets tend to see prices gap higher or lower.

The popularity of trading gaps is seen by the fact that it is often employed by professional futures day traders and also the simple to understand rules makes it a perfect way to get started with technical analysis trading. The E-mini futures contracts being one of the most popular of the stock index futures trading contracts is known for the fact that price action respects the technical analysis. It is not uncommon to find various E-mini trading strategies and among the different approaches to trading E-mini futures contracts, trading with gaps is one of the easiest of all trading methods whether you want to trade the E-mini S&P500 or the E-mini Dow futures contracts.

The basics of trading gaps with E-mini futures is to look for price that gaps above or below from the previous day or session. This usually happens either after the markets reopen from the trading break or at the start of a new trading week or a trading day. Gaps can also occur during the pre-market trading hours and just before official trading starts as well as intraday depending on any unscheduled news or event which hasn’t yet been discounted by price.

In order to trade gaps with the E-mini futures successfully, we need to understand what are price gaps and why they are formed.

What is a gap in price?

A gap, as the name suggests is nothing but a change in open and closing price levels that can occur over two sessions. The sessions can be as small as a 1-minute chart or a daily chart. Gaps occur due to high trading volume at a particular price level which results in prices surging or jumping above or below various price levels and leaving a gap as a result.

A gap is one of the most visually distinctive patterns that can be seen on candlestick and bar charts. It depicts the discontinuity between two price bars or sessions on the chart.

Gaps can occur at the start of a trading session or when there is low liquidity in the markets. In some instances, an important news release can also result in prices gapping higher or lower but this is often found on the smaller time frame charts.

A gap, from a technical perspective and in the context of trend is defined into three types:

  • Breakaway Gap: A breakaway gap is often said to occur during the start of a new trend and depends on which point in time and price the breakaway gap occurred
  • Runaway Gap: A runaway gap occurs in the middle of a trend and is said to show a renewal of the previous trend. When trading gaps, a runaway gap offers the biggest success in trading with the trend that was formed previously with a breakaway gap
  • Exhaustion Gap: An exhaustion gap is the final leg of the trend and occurs as the existing trend nears exhaustion. An exhaustion trend can also be defined as a breakaway gap especially if a new reverse trend starts immediately

Besides the above definition of gap, the gap itself can be classified into two major categories.

  • Full Gap: A full gap is defined as a pattern where the opening price of the current bar or candlestick is greater than the previous session’s high. A full gap can be a full up gap or a full down gap.
  • Partial Gap: A partial gap is defined as a pattern where the opening price of the current bar or candlestick is higher than the previous session’s close but not higher or lower than the previous session’s high or low.

The chart below shows an example of a full gap and partial gap, which is easy to identify visually.

Example of partial gap

The above chart shows a partial gap where price opens below the closing price of the previous session but not above or below the previous session’s high or low.

The next chart below shows an example of a full gap. Here you can see how the opening price of the bar/session was completely above the previous price bar.

Example of full gap
Example of full gap

When trading gaps, it is important to understand the difference between the partial and a full gap. Generally, a full gap is the stronger of the two patterns and is more reliable in trading, while a partial gap will need some extra caution and validation from other methods. Partial gaps are more common compared to full gaps.

Having the above information, let’s look into four simple gap day trading strategies with E-mini futures.

#1. The evening/morning star pattern

The evening star pattern (and its opposite, morning star pattern) is one of the easiest of gap patterns that you can trade. The occurrence of the evening star pattern is not very common but when it does occur, the pattern can be considered to be highly reliable.

An evening star pattern is made up of three price bars or candlesticks with a price gap on either ends. An evening star occurs at the top end of a trend, while its opposite, the morning star occurs and the bottom end of a trend.

Evening star pattern on a 5-minute E-mini S&P500 chart

The above chart shows the evening star pattern that was formed after a steady rise in prices. This was a strong pattern as gaps were formed on both the left and right side of prices. An evening star pattern is bearish and can signal a reversal or a retracement to the trend. With an evening star pattern, you can reliably take short positions after the low of the evening star pattern is breached.

The next chart below shows the opposite, which is a morning star pattern. This usually forms near the bottom end of a downtrend and can signal a short term reversal in prices. Unlike the evening star pattern above, which is a near text-book set up, the morning star pattern is a rather mild version. Still, the validity of this pattern is based upon the full gap which as we know is a more reliable gap that one can trade.

Following the morning star pattern, prices eventually start to push higher. Long positions can be taken after the high is breached.

Morning star pattern with a full gap

The most important aspect of trading the morning and evening star patterns are the two gaps that are essential to validating the pattern. As illustrated above, a full gap on the pattern is a lot more stronger pattern than a partial gap.

#2. Gap as support/resistance levels

Due to the strong price action formed on account of gaps, they can be a reliable support or resistance levels. Traders can therefore look at gaps in prices (the stronger the gap, better the level) and plot the support and resistance levels accordingly and trade the bounce off such levels.

The next chart below shows two gaps that are formed. The first full gap that is formed has managed to turn to resistance level. Due to the fact that the gap was a full gap, the resistance level was more reliable. On the other hand, the small gap zone formed on the basis of a partial gap was easily broken on the second attempt to the downside.

Using gap as support - resistance levels
Using gap as support – resistance levels

In this approach, the purpose of using gaps is merely to identify support and resistance levels. Once the levels are plotted, day traders can then use any of their own trading methods and trade the levels. The only thing to bear in mind here is that a full gap will serve as a stronger resistance or support level than a partial gap.

Day traders should apply some objectivity to this method as analyzing too many gaps can often yield many price levels that will eventually weaken or confuse the price bias.

#3. Trading Gap pullbacks on E-mini futures

Gap pull backs are one of the common ways to trade the gaps. In this approach, the conventional method is to wait for price to gap up or down and then buy or sell on the pull back. This method works well on stocks but on the E-mini futures contracts, the pull backs can be quicker and a bit different.

A modified approach to trading the gaps is to firstly plot the gap zone that was formed. Once the levels are plotted, day traders can wait for the zone to be breached and retested with a subsequent buy or sell order initiated. The chart below shows a gap that has been plotted.

A long or a short order can be placed at the high or the low which would be validated by price bouncing off the gap zone.

Trading pull backs to the gap zone

In the above chart we can see a first long position that can be placed on the initial high. In this set up, the long order would have been triggered if price tested the gap zone and bounced back taking out the previous high. However, this didn’t happen and price fell below the gap zone forming a low. A short position is now placed provided price bounced off the gap zone and took out the initial low, which again did not happen.

Finally, price breaks above the gap zone and forms a local high and then dips back into the gap zone. This time, price breakout above the local high, triggering the long position.

#4. Trading the opening gap

On some trading days, the E-mini contracts can open with a small gap during the start of a new trading session. This might not be visible or prominent on higher time frames, but when you look to the 1-minute chart the gaps are easy to identify. In this method, simply plot the gap zone at the open. Sticking to the 1-minute chart, go long or short on the market after a bullish or a bearish candlestick pierces and closes above or below the gap zone.

The chart below shows the price zone that was plotted after the initial gap was formed. A few minutes later we have the first sell signal of the day with a bearish candlestick piercing and closing below the gap zone. A short order is taken here and held for 1-minute and closed out.

Trading the opening gap on 1-minute chart

A few sessions later, we have a bullish candlestick that pierces the gap zone. A long order is taken on the bar close and held until the next bar closes. This method is applicable for day traders and works best during the first two hours of the trading session.

The above four strategies are by no means the only way to trade gaps on the futures markets. Traders can look at developing their own gap trading strategies on the E-mini futures contracts. The key in determining the success of any gap trading strategy is the fact that the method should be tested in different market circumstances (sideways, trending markets) to fully understand the pros and cons of the gap trading strategy that you want to develop. Therefore, before putting any strategy to the test with real money, futures traders should always test the gap trading strategies on a simulated trading account in order to be fully familiar with the trading system that they will make use of.

Besides having to back test the gap trading strategy, day traders should also focus on the instrument in question. For example, gaps that are formed on E-mini stock indexes such as S&P500 or the Dow can be different to the gaps that are formed on wheat futures for example. Therefore, day traders should not make the mistake of treating all the gaps equally regardless of the instrument that they are trading. As mentioned, the best way to put a strategy to test is to back test on a simulated trading account. Remember that a gap trading strategy that is used in one market will not guarantee same results when used in a different market, which is one of the reasons why that any trading strategy that you come across or design on your own, needs to be thoroughly tested across different market conditions and instruments before using it on your real trading account.