Chande Momentum Oscillator Indicator Definition
The chande momentum oscillator (CMO) was developed by Tushar Chande and is a technical indicator that attempts to capture the momentum of a security. Chande discussed this and many other indicators in his book “The New Technical Trader”. The chande momentum oscillator indicator differs from other technical indicators like the RSI and MACD, because it uses up and down days in both the numerator and denominator. Below is the formula for the chande momentum oscillator:

Su is the sum of the difference between today’s close and yesterday’s close. Sd represents the absolute value of the difference between today’s close and yesterday’s close on down days.
Chande Momentum Oscillator Overbought & Oversold Levels
The CMO indicator is a unique oscillator, but like all other oscillators, it has overbought and oversold levels. Since the indicator is based on previous closing prices, it will oscillate between +100 and -100. Traders use a general rule of thumb that when the chande momentum oscillator is greater than +50 the security is said to be overbought, while a reading below -50 is considered oversold. Traders should not simply buy or sell a security because the indicator crosses these thresholds, this is a sure way to lose money.
Trading with the Chande Momentum Oscillator Strategy
Trading with the chande momentum oscillator as a standalone indicator can prove a challenging task. Since the indicator will oscillate between +100 and -100, a break of +50 could mean that it is overbought, but remember the indicator has another 50 points it can run. What many traders do is to apply a moving average to the indicator and will use crosses of the CMO and a simple moving average to generate trade triggers. Another approach is to trade a security when the chande momentum oscillator has reached extreme readings. Extreme readings are an indication that a strong trend is in place, and traders will add to their positions on any minor corrections.
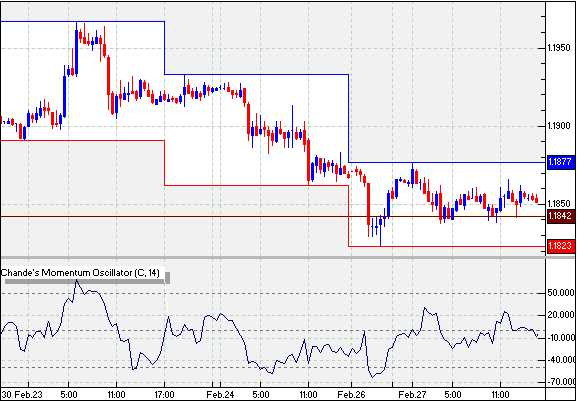
Chande Momentum Oscillator Charting Example
The below chart is courtesy of CMS Forex.

“surely they are an indication of a highly overbought or sold position therefore rather than being indication of a strong trend it should be an indication that that trend is about to change!?”
This is exactly how I use the indicator except I use multiple unit settings (two short terms, one intermediate, and a long term line). Extreme outputs on any oscillator are almost always a signal to enter the opposite position, so I don’t understand why the author would give this suggestion.