The SimCast Ep. 6: Ricky Analog on Risk Management, Mentors, and Pumps
Tag: risk management
In Episode 6 of The SimCast, we had the opportunity to sit down with Ricky Analog of TrueTraders.net. In this episode we use one of Ricky’s recent trades in $CEI to discuss the importance of risk management and key technical levels. Pay close attention to how Ricky discusses waiting for the backside of the trade.
Ricky Analog the Mentor
We discuss a range of topics like how Ricky got started and how his early failures taught him to succeed. Mentors were a huge impact on his life. Now, Ricky spends a lot of time mentoring his own students.
Here’s one great quote from the interview that stands out about Ricky’s mindset on losses:
You’re not climbing out of a hole; that’s just where you’re starting from. You can’t win those chips back.
Ricky Analog
Ricky is an expert when it comes to digging for fundamentals and filings on stocks, especially pump and dumps. In fact, he’s got his own YouTube series teaching new traders how to DDIG for these filings. Be sure to check out that series if you are interested in learning how to comb through filings.
Also, be sure to follow Ricky for his Sunday prep on YouTube. He’s always offering up some great free advice and ideas every Sunday. You can find him on Twitter at @RickyAnalog.
SimCast Ep. 6 – Chapters and Topics
Intro
Background – 3:10
Early struggles – 5:30
Risk Management – 7:00
$CEI – 14:48
Pump Cults – 25:30
Mentorship – 42:00
Outro – 49:10
The shooting star is a single bearish candlestick pattern that is common in technical analysis. The candle falls into the “hammer” group and is a first cousin of the – hanging man, hammer, and inverted hammer. If you’re unfamiliar with any of these patterns, check out our Quick Reference Guide.
Our trading expert, Aiman Almansoori describes these patterns and how to trade them in a fantastic webinar. Be sure to follow our YouTube channel to watch more educational content like this.
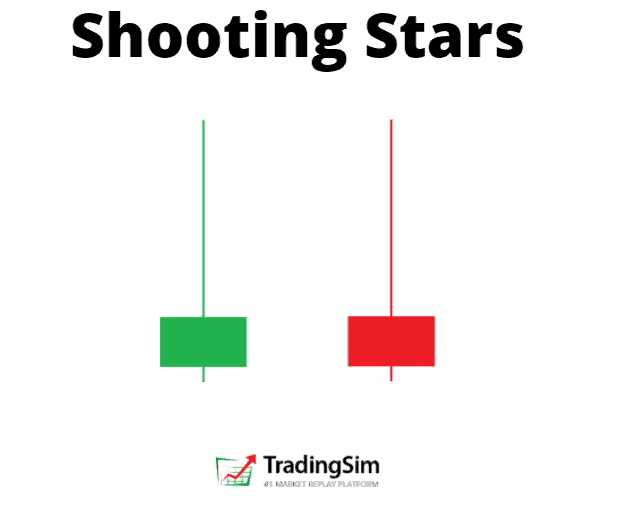
What is the Shooting Star Candle?
The shooting star has a small body and a very long upper candle wick.
As you see, the candle has a small body located in the lower part of the pattern.
However, this also looks like an inverted hammer candle pattern.
So, how can we distinguish the two? The answer to this question is hidden in the price direction before the creation of the candle.
The shooting star candle is a reversal pattern of an upwards price move. The inverted hammer occurs at the end of a down trend.
Shooting Star Confirmation
If a stock is in a bullish uptrend and you identify a shooting star candle, then there is a solid chance that the trend will reverse. For this reason, traders use this candle to enter short trades on the assumption that the bullish move is running out of steam.
shooting star candlestick potential
Once you are able to identify the shooting star, you should look to open a short position on a break of the low of the candle.
The expectation for the profit potential for the shooting star is 3:1 the size of the candlestick.
Here is an example with AMC. Note that we are aiming for 3x the width of the shooting star candle:
AMC bearish shooting star candlestick pattern
Psychology of the Pattern
The shooting star candlestick is considered one of the most reliable candlestick patterns. One of the reasons for this is the unique structure – a small body with a high upper candlewick.
The psychology of the trade has many layers of complexity.
First, buyers are enjoying their gains as the stock shoots to a climactic high. As this euphoric moment begins to set in, short traders begin to sell the stock on a flurry of buy orders.
At this point, the longs who were late to the party begin to get scared and start to sell out as well. This panic long selling and short selling leads to a sharp reversal in the price action, thus generating a small candlestick body on the chart.
It is important to mention that the shooting star candlestick pattern is even more reliable when it develops after three consecutive bullish candles.
This creates exponential bullish pressure on the chart. In other words, exhaustion.
In such cases, the shooting star candle is likely to have an even bigger upper candlewick. This implies that the price is about to reverse with even bigger strength.
3 Steps to Trading the Shooting Star
1) Trade Entry
Before entering a shooting star trade, you should first confirm the pattern.
Here are handful of criteria to ensure success:
Identify an active bullish trend.
Spot a candle with a small body and a big upper candlewick.
Wait for a bearish candle to break the low point of the shooting star body.
Ensure elevated volume, signifying heavy supply
This will confirm the validity of your shooting star on the chart.
If you are able to identify the presence of these signals, then you should short the security. After all, you are anticipating an upcoming bearish price move.
2) Stop Loss
You should always use a stop loss order when trading the shooting star candle pattern. After all, nothing is 100% guaranteed in stock trading, and you may experience false signals when trading the shooting star pattern.
For this reason, place the shooting star candle pattern above the upper wick of the pattern.
3) Taking Profits
The price target for the shooting star is equal to the size of the pattern (the length of the candle).
Similarly, our target is for a price move equal to three times the length of shooting star, including the wick.
Shooting Star Trading Strategy
Now that we have the shooting star confirmation criteria behind us, we will combine these three basic steps into a trading strategy.
Example #1
This is the 2-minute chart of Hewlett-Packard from June 10, 2016. The image illustrates a classical shooting star trading example.
shooting star trading strategy
Our trading analysis starts with identifying that the price is trending upwards.
Suddenly, a shooting star candlestick appears, which is marked with the green circle on the chart. We have a small candle body and a big upper candlewick, which confirms the shape of the pattern.
Entry
The next candle after the shooting star is bearish and it confirms the pattern.
Therefore, we sell the security after the pattern confirmation. At the same time, we place a stop loss order above the upper wick of the shooting star candle in order to secure our short trade.
This way, if the price creates an unexpected bullish move caused by high volatility, we will be protected.
Our maximum loss will be equal to the distance between the level we short HPQ and the level of the stop loss order.
The first blue arrow on the image measures the size of the candlestick. According to our shooting star trading strategy, we should seek a target equal to three times the size of the pattern.
Profits Raining
Thus, we apply the size of the pattern three times starting from the lower candle wick. This is how we get the big blue arrow, which points out the minimum target of our trading strategy.
shooting star trading strategy
In order to maximize our profits, we need to stay in the trade until the price action closes a candle beyond the minimum target.
On the way down, the price creates one correction during the bearish move. The downward activity then resumes and 18 periods after we short HPQ, the price action closes a candle below the minimum target of the pattern.
Exit
Luckily, this candle is relatively big and goes way beyond the minimum target. A perfect opportunity to exit.
As you see, the shooting star candle pattern gives us an indication that the trend might reverse. This creates a nice premise to short HP right in the beginning of an emerging bearish trend. Despite the small correction on the way down, the shooting star reaches the target of three times the size of the candlestick.
Example #2
Let’s now try this strategy one more time on another shooting star trading example:
shooting star trading strategy 2
We now have the 1-minute chart of Apple from December 22, 2015.
The chart starts with a price increase – Apple creates higher highs and higher lows. On the way up, the price action forms a shooting star candlestick pattern on the chart (the green circle on the image).
Now we have a reason to believe that the price action could be reversed. We wait to see if the next candle is going to confirm the authenticity of the shooting star reversal pattern.
Entry
Fortunately, the next candle is bearish and breaks the low of our shooting star candle on the chart. This gives us a strong bearish signal and we short Apple at the end of the bearish candle. At the same time, we place a stop loss order at the highest point of the shooting star – above the upper candlewick.
Now, the trade is protected against rapid price moves contrary to our trade.
Raining Profits
The blue arrows on the image measure and apply three times the size of the shooting star candle pattern. After we short Apple, the price enters a downtrend.
After the first bearish impulse on the chart, the price creates a range between $107.30 and $107.40 per share. The range is then broken and the price action creates a new bearish impulse on the chart.
This impulse leads the price to complete a total bearish move of three times the size of the shooting star pattern. This is the minimum target for our trade and we close the position.
Another successful trade in the books.
Recap
The shooting star falls into the “Hammer” candle family.
There are three basic tricks for trading the shooting star candlestick figure:
Sell the security after the creation of a bullish trend, a shooting star candle, and a bearish confirmation candle.
Put a stop loss right above the upper candlewick of the shooting star figure.
Stay in the short trade for a bearish price move equal to at least three times the size of the shooting star candle including the upper and the lower candlewick.
This shooting star trading strategy contains around 3:1 Win-Loss ratio.
How to Practice This Strategy
If you find yourself overwhelmed or new to candlestick patterns, the best way to get a firm grasp of the strategies is through deliberate practice.
There is no more efficient way of doing that than in a trading simulator with a realistic trading environment.
To that end, we’ve put together a handful of reference guides for the best bullish and bearish candlestick patterns to help guide you along the way. So, be sure to check those out and download our cheat sheets.
We have discussed a number of candlestick patterns on the Tradingsim blog. If you haven’t checked out our other resources be sure to do so, you’ll find a really nice candlestick pattern cheat sheet to help with your training. But for today, we’ll focus on the long and short side of the Abandoned Baby candlestick pattern.
In this post, you will learn how to spot both bearish and bullish abandoned baby patterns, how to trade them, and some caveats to watch out for.
If you would like to watch a video tutorial on how to trade candlestick patterns, subscribe to our Youtube channel. Our trading expert Aiman Almansoori has put together a great webinar on the topic.
Abandoned Baby Definition
The abandoned baby candlestick pattern is a three bar reversal pattern. It is similar to the morning and evening star formations and is a very reliable reversal signal when it occurs after a sharp rise or drop.
While it is very similar to the morning star and evening star, it has one key difference. The real bodies and shadows cannot overlap from bar 1 to 2 and 2 to 3. This makes this pattern very unique, rare, and reliable at the same time.
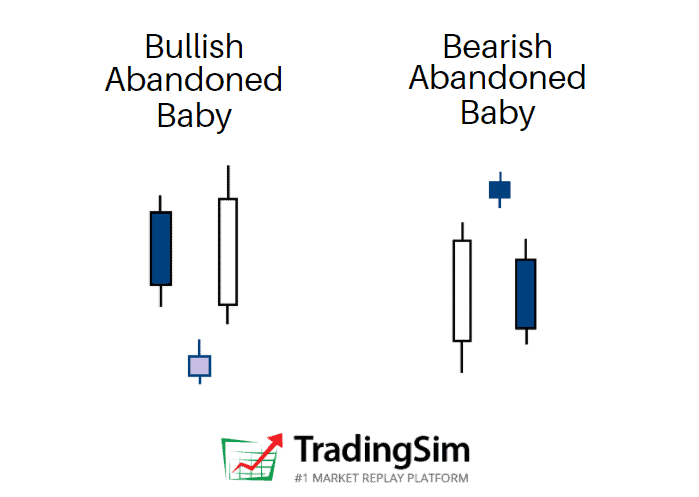
Structure
The first candlestick is in the direction of the primary trend
The second candle is a doji which gaps in the direction of the primary trend, exhibiting no overlap with the real body or shadow of the previous candle
The third candle is in the opposite direction of the first day and gaps in the opposite direction of the doji.
When you think of the psychology of a candlestick pattern, it is best to think about the “story” between the bulls and bears. This can really help your confidence in knowing when to take the trade and understanding the context behind the pattern.
For example, during rallies off the bottom of an extended downtrend, a abandoned baby bottom can be very rapid as short sellers will be forced to cover fast.
Conversely, during declines after extended uptrends, the abandoned baby top can be just as fast as many longs sell their positions, aiming to keep most of their profits.
To that point, the abandoned baby represents a crossroads, or “indecision” at the top or bottom of a trend reversal. Within the candle is usually a lot of activity between retail buyers and institutional sellers, or vice versa. The result is typically a large amount of volume.
That volume tells us that a lot of effort went into the candle, but with little result, signaling the reversal.
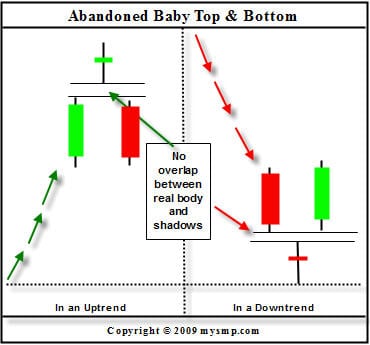
Chart Example
Abandoned Baby
In the above candlestick charting example, notice how the abandoned baby top comes in after a strong uptrend. This leaves the bulls trapped at the top of the formation with very little time to exit their winning positions, especially if they were buying at the top.
To the right of this formation is the abandoned baby bottom. This is the exact opposite of the abandoned baby top and is often the sight of a sharp short squeeze.
Congratulations! You are now familiar with the structure and characteristics of the abandoned baby candlestick pattern. Now it is time to apply trading techniques to the strategy with real market examples.
Trading the Abandoned Baby Candlestick Pattern
Bullish Example #1
We will now review a couple of chart examples, which show the price behavior after an abandoned baby candlestick pattern.
Bullish Abandoned Baby – Trend Increase
This is the 5-minute chart of Bank of America from June 2, 2015.
There is a clear downtrend, followed by an abandoned baby candlestick pattern, which is shown in the green rectangle.
After we identified the pattern, a strong uptrend emerges and BAC’s stock price increases a total of $0.25 per share. This may not sound like much of an increase, but Bank of America is a Titanic of a stock.
With larger cap stocks, what you are giving up in profits you don’t have to worry about in terms of risk.
Bullish Example #2
Let’s now review another example of this unique candlestick pattern.
Abandoned Baby – Trend Decline
This is the 5-minute chart of Netflix from May 5, 2015.
In the chart above, we see a bearish trend followed by an abandoned baby reversal candle pattern. You can see the formation in the green rectangle.
This time, the abandoned baby is a doji candle, which gives additional reliability to the pattern. The next candle opens with a gap from the abandoned baby, which confirms the pattern.
The followed bullish move is so strong, that even the next candle after the confirmed pattern opens with a bullish gap.
This trend reversal leads to a $3.42 price increase in Netflix.
Bearish Abandoned Baby Example
The lesson wouldn’t be complete without seeing this pattern play out bearishly.
Before the Covid Crash of 2020, the QQQ etf produced a beautiful climactic abandoned baby pattern before crashing for the next 4 weeks.
QQQ bearish abandoned baby chart
As you can see, this topping pattern occurred at the very top of an extended bull run, signaling the reversal. Perhaps the astute trader could have foreseen the crash if he’d known about this pattern?
Trading the Abandoned Baby
The good thing about the abandoned baby candlestick pattern is that if you spot it on the chart, you can trade it right away!
It is not necessary to use additional trading indicators to confirm the signal, because the pattern is pretty reliable.
This doesn’t mean that the pattern will work 100% of the time, so don’t go overboard!
Stop Loss Orders
When you trade the pattern you should always protect your trade with a stop loss order. The proper location of your stop should be or below the middle candle of the formation, depending on the direction of your trade.
Also, feel free to put the stop as tight as possible.
Profit Targets
You can always use a moving average or an oscillator to exit a trade. The other option is to rely on basic price action rules to close your profitable position.
In order to understand how this works, we’ll show you how to implement a few techniques when trading the pattern:
Abandoned Baby – Stop Loss
Above is the 5-minute chart of Electronic Arts from Oct 20, 2015.
After a strong price decrease, we see a candle which gaps down from the bearish trend (green rectangle). The next candle gaps up and we confirm a bullish abandoned baby.
We go long when the last candle of the pattern closes the period. Lastly, we put a stop loss order right below the lower wick of the abandoned candle as shown on the image.
EA’s stock price begins an impulse move higher and we start following the price action. Notice that the first candle from the pattern and the previous candle form a resistance area (blue horizontal line).
On its way up, EA breaks this resistance level. The price starts consolidating and the previous resistance begins acting as support (See the black arrows on the chart for reference).
The price starts increasing afterwards and breaks the high of this congestion area.
Notice that the two low wicks during the price hesitation help us build a bullish trend line – starting from the abandoned candle. The EA price tests the trend a couple more times without breaking it.
For this reason, we stay with our long position until the market closes.
In this trade, we generated a profit of $0.74 (74 cents).
Money Management when trading the Abandoned Baby Pattern
The abandoned baby candlestick pattern is one of the most reliable patterns.
As shown above, you can place tight stop loss orders when trading abandoned babies. This is because even a small contrary move will indicate that the pattern is false.
In the trade above, our stop loss was 0.42% from our entry price. Therefore, if you were to invest $40,000 of your buying power, a false pattern will lead to a maximum loss of $168.
However, the trade was successful and lead to a profit of 1.1% which translates to $440.
Managing with Moving Averages
Let’s now review another abandoned baby trade. This time though, we will rely on an exponential moving average to exit our trade.
Abandoned Baby – Profit Targets
Above you see the 5-minute chart of JP Morgan Chase & Co. from Nov 3, 2015. I have placed a 30-period exponential moving average on the chart, which is the blue curved line.
The chart begins with a price decrease, marked with the red arrow. At the end of the price decrease, we see a candle gapping down. This should be a signal for us that a potential abandoned baby candlestick pattern might occur on the chart.
Entry
The next candle gaps up and we confirm the pattern with its closing – we go long!
Let’s say we have a bankroll of $25,000. Since we have a day trading account we have a maximum buying power of $100,000.
Since the bullish and the bearish abandoned baby candlestick patterns are considered very reliable, we will invest 20% of our buying power. So, we invest $20,000 in a long trade based on an abandoned baby signal.
Stop Loss
Our stop loss is set below the lower candle wick of the abandoned candle. This is shown on the image above. In this trade, the stop is -0.45% from the entry price. This way, if our trade is unsuccessful, we will lose $90 (20,000 x 0.0045).
Abandoned Baby – Profit Targets
After the confirmation of the pattern, JPM stock begins increasing. JPM reaches $65.86 and starts a corrective move. Notice that the price decreases, but it finds support at our 30-period EMA.
JPM price expands and breaks the $65.86 top and shoots to $66.06. Then we see a new decrease to the 30-period EMA. The price starts crawling on the exponential moving average afterwards; however, the level sustains the pressure of the price and we notice a new bounce from the 30-period EMA.
Exit
Although the price makes more of a sideways move rather than an increase, we see a new top at $66.10. The followed price action is in a bearish direction. The JPM stock price breaks the 30-period EMA, which is our signal to exit the trade.
In this trade, we managed to catch a .71% increase in JPM. This breaks down to a profit of $142 while risking $90. This gives us a 1: 1.58 risk-to-return ratio. Although this doesn’t look very impressive, $142 dollars here or there can add up to a mortgage payment at the end of the month.
Although the example above only uses 20% of your buying power, you can always invest more if you have really tight stops.
In comparison to other patterns, where you sometimes risk 2%, the abandoned baby candlestick pattern does not require you to have wide stops.
Just remember: you must use a stop loss order when trading abandoned babies. If you don’t place a stop, an unlucky trade might lead to tremendous losses, since you are leveraging your capital.
Recap
The abandoned baby is a three candle formation.
It resembles the evening and the morning star.
The doji candle needs to gap from the two candles which sandwich the pattern.
There should be no overlaps between the middle candle and the two candles surrounding it.
The abandoned baby is one of the rarest candle patterns.
A stop loss order should always be used when trading the abandoned baby candlestick pattern.
Stop loss proper location is at the end of the lower candlewick of the abandoned candle.
You can invest more than you usually invest in your deals when trading abandoned baby candle figures. There are two basic reasons for this:
The abandoned baby is a pattern with a very high success rate.
The stop loss when trading abandoned baby figures is usually placed very tightly. In some cases, you will risk less than 0.5% of your investment.