It just sounds menacing, doesn’t it? And for good reason.
If you’ve ever been caught in one on the long side, you understand the pain.
What Is A Kill Candle?
Day trading legend Bao Nguyen, @modern_rock on Twitter as he is known, prefers to call it a death candle. His education service MyInvestingClub covers this candle in a few of his popular shorting courses.
But regardless of what you call it, death candle or kill candle, the result is bloody for bulls.
This pattern has become so notorious that professional day trader @rocketcatchnbob, who airs his trading day live to thousands of viewers, made “kill candle” t-shirts for his followers.
@rocketcatchnbob’s kill candle t-shirts
As transparent as he is, @rocketcatchnbob admits giving up a $100k profit day, settling for $10k after getting caught in one of these red daggers — just to show how brutal these candles can be. His accompanying video is a great tutorial on what to watch out for.
Yet for every kill the candle makes, there is always a short trader making a killing on the flip side. And depending on the setup and the skill of the trader, this candle pattern can actually be anticipated.
The Flip Side
As bulls were getting slaughtered on COCP at 2pm that day, someone else was profiting.
More often than not, they’re centered around the formation of one of these kill candles.
To that point, on this infamous day in May, COCP fit the bill for his 2-3pm “Bloodbath setup.” As ADF likes to say, “it always arrives on time.”
COCP Kill Candle
Who knew trading could be so scary? 21% of the stock’s value gushing out in a single 1-minute candle.
Such is the world of low float, high volatility momentum trading.
But putting aside the gore, carnage and disappointment, there is a method to the madness here, as with most patterns in the market.
Our goal in this post is to highlight some key characteristics of these candles and uncover three strategies that may help you uncover significant profits if you decide to trade them.
Or, at the very least, learn to anticipate and side step the carnage.
How To Spot One
A kill candle does what you would assume. It kills the upward momentum of a trend at the very least. The best ones reverse the trend in a single candle.
Criteria To Look For In Kill Candles
A large-bodied red candle
High Volume
Bearish engulfing characteristics
Distribution leading up to the candle print
(Usually) a failed breakout attempt
When we say a large-bodied red candle, we don’t mean “just any ‘ol red candle.” We mean something significant — more than likely the most bearish candle on the chart, accompanied by the heaviest (or heavy) volume signature on the chart.
It should look something like these examples:
2-3pm Selloff + Kill Candle:
Here are two examples of the end of day strategy that @team3dstocks uses often. It is also known as a “late day fade”.
COCP Kill Candle
LEXX 2-3pm bloodbath setup
10am VWAP Boulevard + Kill Candle
We cover this strategy in detail in a different post that is well worth your time. Another one from @team3dstocks, it has a very high success rate when all the criteria are met.
VWAP Boulevard kill candle example
Range Bound Multiple Kill Candles
Not all kill candles will work immediately, as was the case with BLRX. Keep in mind that algorithms, institutions, chat rooms, and deep-pocketed traders can “manipulate” stocks with such low floats.
BLRX Multiple Kill Candles
Sometimes you may see more than one kill candle. BLRX had multiple flushes, and they all occurred at the highs. As with any setup, if the trade recovers, respect your stops.
Kill Candles At The Opening Bell
Opening Bell Kill Candle
Kill Candles can present themselves at the open as well. Opening Range Breakdowns are a great strategy for the open and can often include a nice kill candle after buyers get stuffed.
As you can see, kill candles can show up just about anywhere. That being said, there are a few caveats when trading this strategy:
Kill candles are more predictable and volatile with small caps
Larger caps usually require some news or other impetus
Without hotkeys, you may have a hard time trading them
The 2-3pm Bloodbath Setup
We’ll take the time now to dig a bit deeper into the setups associated with the kill candle.
No doubt many momentum day traders have probably seen this pattern play out in the afternoon. It goes by a few different names, like “late day faders,” “2-3pm selloff,” or the dramatic “2-3pm bloodbath” popularized by AllDayFaders.
For more info on this, we have a post entirely dedicated to the strategy.
Float and Institutions
Regardless the name, there are a few criteria to consider. The most important being the float size and the shares traded. AllDayFaders notes why this is very important for the strategy:
According to ADF, institutions must close their positions before the end of the day, otherwise it is considered a “holding” and has to be filed.
If this is the case, then it makes sense for a proprietary trading firm, hedge fund, or insiders manipulating the float to support the bid up until the bloodbath. Once time is expired, the bid collapses and the fund walks with whatever shares it had, giving it enough time to liquidate down before the close.
It is for this reason that lower float stocks fit the criteria for the pattern as opposed to higher float, larger cap stocks which are harder to manipulate.
Regardless of what institutions are behind the stock movement, the tape doesn’t lie. We can see the footprints leading up to the dump.
What do we mean by that?
Plain and simple. Distribution.
Example
ACY Kill Candle example
In this example, we have a low float runner topping out around $16 for the high of the day. With the image we have shown, you can see that major selling pressure came in at the highs (indicated by the circles).
As the day wore on, the big players continued to prop the bid (demand) in order to make the stock look like a squeeze was imminent. Retail traders bought into the dip or covered there shorts. But time runs out, and 3:00pm and 3:11pm marked the last of the uptrend.
The big buyers walked away and the stock retraced half its value in a short amount of time.
We also like to call this “walking the plank.” A lot of the violent drops occur at the pivot line of an ascending lower channel marker. Others might call these bear flags.
Kill candles that appear at the open can be great shorting opportunities. The best occur as bulls are pushing the stock higher only to be met with a wall of selling pressure.
In a recent trade on ticker CRSR, we see a perfect example of how bulls were trapped into buying a breakout at the open, only to watch the price immediately reverse.
Opening Bell CRSR kill candle.
As a trader, you can anticipate the breakdown if you are nimble with a trading platform geared for fast order-entry. The wick above the breakout line on the chart is our indication that price is stalling and distribution is flooding into the heavy buying pressure.
There is so much selling, in fact, that it overwhelms any bullish demand trying to move the stock upward. The result? A kill candle.
To learn more, MyInvestingClub does a great job explaining this type of setup with their free “Death Line” YouTube webinar.
The Chat Pump Exit
In the small world of momentum day trading, there are a lot of influencers on small cap stocks. Just as CNBC, or well-respected analysts might influence the movement of larger cap names, the small cap world has its chat rooms, social media, and other influencers.
Example of a day trading chat room
Regardless of where the influence comes from, our goal as traders is to simply be aware of the price action on the chart.
To that point, if a chat room with thousands of retail traders is calling out buying opportunities, you can expect that with a small amount of shares available in low float stocks, you’ll see plenty of movement on the chart.
Sometimes, this can provide underlying demand for successful long plays. Other times, bears are lying in wait for the exhaustion, using the opportunity as a “liquidity event” to initiate large short positions.
And at the end of the day, it is all about who won: supply or demand.
And hopefully, there is enough meat on the bone for everyone to get a win.
Example
VCNX is an example of a stock that was being heavily pumped to its members, starting in the premarket and continuing into the regular session.
VCNX Kill Candle at VWAP Boulevard
Admittedly, the bulls had a fantastic run! However, the momentum was eventually exhausted at a prior day’s resistance line we call vwap boulevard, credit to AllDayFaders.
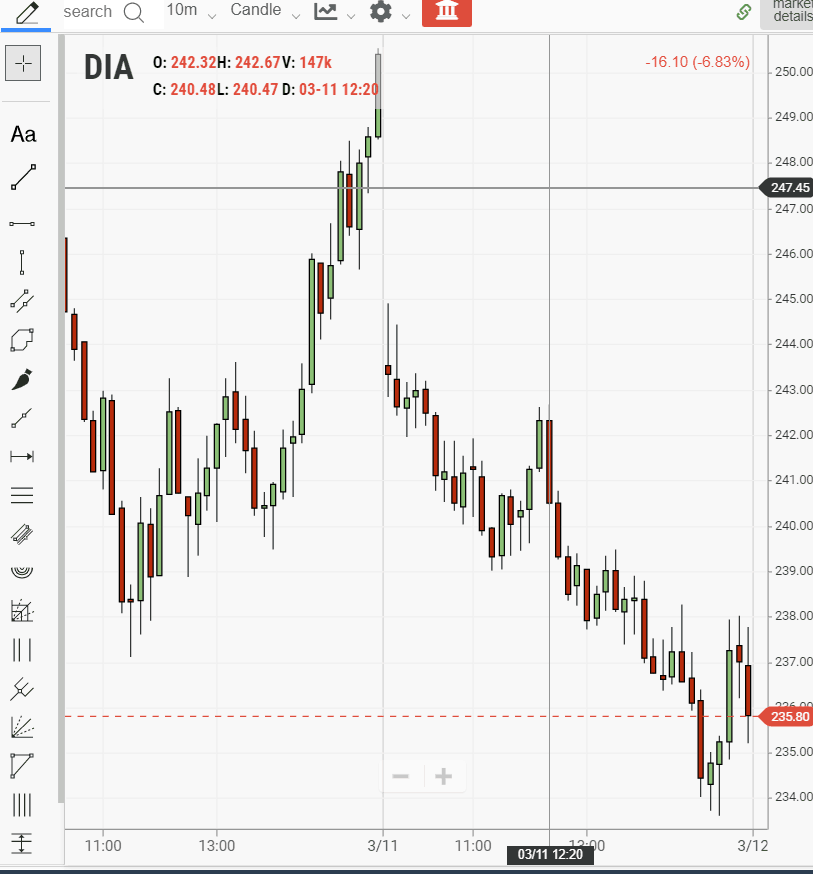
Within seconds of the chat room moderator announcing that he was selling his remaining shares, the bottom fell out of the stock.
VCNX lost 16% of its value in 1 candle. It never recovered that day.
Other Considerations
When trading kill candles, it is important to note that volatility is at an extreme. This may not suit your trading personality or risk profile.
The candles move swiftly, as you can see, and the ability to get filled may be an issue depending on the broker and platform you trade with. Even with specialized trading tools, you may not get filled properly in such a fast-moving environment.
Along the same lines, not all of these securities will be available to short. For that reason, many professional traders use specialized brokers and trading platforms in order to locate shares at a fee.
DAS Short Locate Window
Lastly, it is important to note that these are just a few examples. As you study this pattern over time, you’ll find that the more criteria you can find to support your trade plan, the better.
As with any strategy, it is worth practicing until you can’t get it wrong.
Daytrading is risky enough as as seasoned professional. Make sure you know what you’re doing and have a plan for all of your trades.
Once you’ve created a large enough subset of simulated trades to know your success rate, then you might consider putting real money to work in the market.
Until then, stick to a risk-free environment for learning these strategies and protect your hard-earned money. Save the gambling for Vegas.
Recently, we discussed the general history of candlesticks and their patterns in a prior post. We also have a great tutorial on the most reliable bullish patterns. But for today, we’re going to dig deeper, and more practical, explaining 8 bearish candlestick patterns every day trader should know.
We’ll cover the following:
What these patterns look like
The criteria for confirming them
The story these candles tell
How to set entries and risk for each
Some common mistakes when interpreting them.
Also, feel free to use our quick reference guide below for bearish candlestick patterns! Be sure to save the image for your use with your trading and training in the market!
What Bearish Candlesticks Tell Us
Hopefully at this point in your trading career you’ve come to know that candlesticks are important. Not only do they provide a visual representation of price on a chart, but they tell a story.
Behind this story is the belief that the chart tells us everything we need to know: the what being more important than the why. Each candlestick is a representation of buyers and sellers and their emotions, regardless of the underlying “value” of the stock.
Bearish candlestick patterns typically tell us an exhaustion story — where bulls are giving up and bears are taking over. Many of these are reversal patterns.
Check out or cheat sheet below and feel free to use it for your training!
Without further ado, let’s dive into the 8 bearish candlestick patterns you need to know for day trading!
1. The Shooting Star
In case you were wondering, the names of candlestick patterns usually describe a visual representation to something in real life. The Japanese were fond of naming them that way.
The shooting star is no exception.
When it occurs, it will be at the height of a current uptrend — typically an extended trend.
It’s a lot like a shooting star falling from the heights of the heavens.
At the end of that trend, the stock experiences one last effort to push higher, only to reverse on itself. Hence the name, shooting star.
It goes up, only to fall back.
Entry
Where would you enter?
More aggressive traders may anticipate the reversal as the candle is forming. Otherwise, you can wait until the close of the shooting star, enter, and set your stop at the high of the shooting star candle.
Shooting Star Example
AMC provides a great example of this pattern during a recent intraday session. Notice that the trend was clearly upward and becoming extended. The stock makes a climactic push to new highs, then reverses on increased volume.
AMC with a fantastic example of a Shooting Star
Also, notice that the second reversal candle beyond the shooting star. It retraces slightly into the wick of the shooting star. This is a great example of why your stops/risk need not be too close, or wait for entry on the second candle.
This reversal pattern can be seen in different contexts. It can occur off the open, or in an extended uptrend.
The thesis behind the pattern points to strong supply levels that completely surpass the effort of bulls to push a stock upwards. The result: the price opens above the preceding candle, then commences to sell off forcefully.
The body of the candle completely “engulfs” the prior candle, and should close below it.
Entry
There can be a few discretionary entries on this pattern depending on experience. Aggressive traders may choose to enter as the candle is forming, if supply is clearly visible. This is more of an anticipatory entry.
If trading “by the book”, you may want to wait until the new low is confirmed, then enter on the next candle.
Ideally, you want to trade in either the direction of the larger trend, or enter as an overextended trend reversal.
Set your stop in the body of the candle or at the high of the candle depending on its range.
Bearish Engulfing Examples
FCEL is a perfect example of this bearish candlestick pattern on the 5-min chart. Notice that the stock is trending downward from the pre-market. It is also struggling with VWAP, the red indicator line on the chart below.
FCEL with an opening range breakdown and Bearish Engulfing Crack
Off the open, the stock tries to push higher, but we notice some selling pressure in the upper wick of that first green 5-minute candle. The price then moves lower, engulfing that candle with ease of movement to the downside.
BA provides us with another look at this bearish candlestick pattern in a different context.
BA with an overextended bearish engulfing candle
Notice the reversal from an extended intraday run here. Just like the example above, the 5-minute candle completely engulfs the prior candle. This time, it is with increasing volume.
What does that tells us?
Think in terms of effort vs. result. The effort (volume) increased and the result (price) was a complete retracement downward (link to effort/result).
This gives us the confidence to go short, risking toward the highs.
3. Bullish Engulfing Sandwich
Do not be confused by the name. This is also called a “stick sandwich”. It is not a bullish pattern in this particular scenario.
The point here is that the “bullish” engulfing candle in the middle of the pattern is “sandwiched” by bearish candles.
In this instance, it takes more than a single supply candle to overcome the demand. It takes three or four candles for the pattern to confirm.
First, you have what appears to be a bullish engulfing candle (the opposite of the bearish engulfing candle we just identified above). Then, instead of confirming new highs, the stock reverses again.
Context is everything here. In the example below, you’ll see that the general trend is downward. For this reason, the bullish engulfing sandwich can be thought of as a continuation pattern.
Entry
Entry is on confirmation of a breakdown — lower lows on the reversal candle. Stops can be set in the body of the candles above.
Bullish Engulfing Sandwich Example
FUBO provides a fantastic opportunity to see this bearish candlestick pattern in action right at the opening of the market.
FUBO intraday Bullish Engulfing Sandwich pattern
Notice that the trend is downward from the premarket. It was also continuing downward from the day before.
The stock stalls at vwap, struggling. It tries to reverse, but notice the volume on the green reversal candle. It is no match for the supply in the first 5-minute candle of the day.
The effort in that first candle dwarfs the efforts of the bulls.
The stock then reclaims vwap, its downward trajectory, and the bulls submit to the bears one more time.
Learn more about this bearish pattern and it’s bullish counterpart in our blog post covering the Stick Sandwich.
4. The Evening Star
We’ve included the Evening Star with the Evening Doji Star because they are very similar, both in style and in context.
Each are bearish candlestick patterns.
Leading into the star, you’ll need to spot a wide bodied candle. The star itself is the narrow body indecision candle that follows the upward wide-body candle.
Entry
The confirmation comes with the breakdown on the longer bodied bearish candle. A great place to enter, risking off the highs of the doji candle.
This pattern works particular well at the high of the day as a trend reversal. But it can also be a trend continuation pattern if it appears at the top of a short-lived rally into prior resistance.
Evening Star Example
In this intraday example with GME, we notice that the upward trend has been strong. For the first hour+ of the morning, there have been few, if any pullbacks.
GME with an evening star pattern playing out intraday
However, we notice some selling pressure coming on this 5-minute chart just before 10:30am. Typically we might have played that as a shooting star, but we never got the breakdown confirmation with a close below the body of that candle.
Despite the failed breakdown on the shooting star, it is a warning sign that supply is coming into the market.
The alert trader keeping his/her eyes open for any signs of reversal on this overextended stock would notice the Evening Star forming on increasing volume. Again, the effort (volume) is there, but the result (price) is a small doji candle.
How can we interpret this?
It is likely that there is plenty of profit taking going into this GME Evening Star candle as FOMO (fear of missing out) retail buyers chase the stock higher. Strong hands are taking the opportunity to sell their shares.
This gives the attentive trader an opportunity to capitalize by going short.
5. Tweezer Top
The tweezer top is yet another reversal pattern or continuation pattern.
The 1st element is the wide body bullish candle signaling potential exhaustion in an uptrend. This is followed by weak or no effort to continue higher, hence the reversal.
Ideally, volume is increasing during both of these candles as supply is added to the market as weak hands are tempted to continue buying here.
As a bearish pattern, the two candles should share roughtly the same high if possible.
Entry
Entry can be made on a close below the reversal candle with a stop set at the high.
Tweezer Top Example
Take a look at this AMC tweezer top. Can you see the green and red candles providing the proper representation of the two sides of a pair of tweezers?
AMC putting in a tweezer top pattern intraday
Depending on the range of the candles, you can enter aggressively as the tweezer is forming, especially if supply appears heavy.
Otherwise, you can wait until the candle closes for your entry and set a stop at the high of day, or in the body of the tweezer top. This is discretionary depending on the risk/reward you are looking for, as well as your risk personality and position size.
As you can see from the chart, often times vwap can be a great target area (red line).
6. Dark Cloud Cover
Dark Cloud Cover is the opposite of a bullish reversal pattern called Piercing Line. For the bearish pattern, it must first have a solid green or white bar continuing the uptrend.
After the bullish candle closes, we expect to see another candle try to make new highs. This new candle fails, then closes more than midway into the body of the 1st candle. Hence, the overhead supply is called “dark cloud cover.”
One of the best ways to play this pattern is in an overall downtrend during a short term reversal. As the stock tries to rally into resistance, you can anticipate the end of the rally.
Entry
Positions should be entered as the stock breaks the prior bar with stops set at the high of the candle.
Dark Cloud Cover Example
Occasionally the market gifts us with a nice double top failure in an overall downtrend. RIOT gave us this opportunity intraday recently as it pulled back from the morning lows, only to find resistance at vwap.
RIOT forming a double top with bearish Dark Cloud Cover candlestick pattern
As you can see, RIOT was struggling to overcome vwap on heavy volume the first try. The second try gave us a beautiful confirmation with the Dark Cloud Cover pattern.
7. Shrinking Candles
Shrinking candles are a classic example of effort vs result. It is a bearish reversal candlestick pattern usually accompanied by a huge volume signature below.
The understanding is that the amount of effort to push the stock to new highs is increasing. However, the result is decreasing.
How do we interpret this?
Given the context, it should imply that a considerable amount of selling pressure is adding to the volume as price moves sluggishly upward. This selling pressure is counteracting the demand.
Why else would the candles be shrinking?
Once bulls realize this, it is often too late. Without proper buying underneath, the result can be devastating for long chasers wrongly assuming there is upward momentum.
In essence, there is no synchronicity between volume and price. They are at odds with each other on the way up. An anomaly, if you will.
Shrinking Candles Example
Here is real example from the 5-minute chart of BTBT. As you study this chart, pay close attention to the volume and how it corresponds with each candle.
BTBT displaying a Shrinking Candles pattern intraday
As you can see, the largest amount of volume comes as BTBT tries to rally above the pre-market highs. As it does, the candles begin to shrink.
Momentum is being lost as gravity, supply in this case, strangles this rocket off the morning lows. Strong hands take advantage of morning break out buyers, who are left holding the bags as the stock fades the rest of the day.
Entry
As you look at the chart, hopefully you can pinpoint a great short entry as the last green candle is broken to the downside. The double top is clear, and a close risk/stop can be set at the highs.
8. Hanging Man
Hanging Man is very similar visually to the Hammer pattern. The Hammer is usually bullish at the end of a down trend. However, the Hanging Man is a bearish candlestick pattern at the end of an uptrend.
Selling pressure is the key to recognizing this pattern.
Inside the formation of the candle, there is considerable selling pressure to begin with.
The close at the highs can be misleading in that the selling pressure is mostly overcome as it rallies.
Often times this results in an opportunity to trap longs who may believe the supply was overcome by demand.
However, the supply is still present.
If longs who bought on the way back up are overcome on the next candle, they are likely trapped from their entries and will add to the selling pressure as the stock capitulates.
Hanging Man Example
Check this beautiful uptrend on the recent intraday chart of PLUG. It appears there is nothing to stop the upward momentum. That is, until we get the Hanging Man, signaling the top for us.
PLUG 5-minute chart displaying a Hanging Man reversal pattern
Entry
Ideally the next candle after the close of the Hanging Man would provide the nearest risk/reward entry at the top.
If you aren’t fast enough to enter on the close of the Hanging Man and risk to the highs, it does offer a right shoulder for entry later.
How To Practice Candlestick Patterns
So there we have 8 of the most common bearish candlestick patterns. Now you’re probably wondering how to spot them in real time.
We do have a handful of quick reference guides. These can be a great resource in the moment if you are unsure.
However, learning the context of these patterns is paramount. Otherwise, you may find yourself trading them without proper confirmation. It takes time and experience.
How do you speed up the learning curve?
There is no better way to rapidly increase your exposure to these patterns than in a simulator.
Imagine being able to replay the market for any particular day up to three years in the past. You can do it in your spare time.
Pick a day, pick a pattern, pull up the scanner, and take notes every time you see the pattern play out well.
As you practice, ask yourself these questions:
Where did the pattern occur in a trend?
Did the pattern confirm?
How was volume associated with the confirmation of the pattern?
Would the risk/reward have been worth it for the trade?
Conclusion
We hope you’ll find this lesson a beneficial tool in your short-trading-strategy belt. Nothing beats the ability to read charts well and bearish candlestick patterns are an integral part to that process.
Ever wonder if a doji candle is bullish or bearish? How about a spinning top? Our goal in this tutorial is to uncover the fundamentals of indecision candlestick patterns, their significance, and a few strategies for how to trade them. By the end, you should be able to spot bullish and bearish dojis, spinning tops, and haramis!
The world of candlestick patterns is exciting. It’s like learning a new language, especially when you are new to the world of trading. At first, charts can appear daunting and mysterious. Like a bunch of noise. But with proper education, candlestick patterns can uncover a world of meaning and opportunity.
Before we move forward, if you haven’t studied the basics of candles and candlestick patterns, be sure to check out our introduction guide.
What Are Indecision Candles?
Indecision candlesticks are just that: a candle that represents indecision in the markets at a given point in time. The reflect either a pause in price action, or a temporary stalemate between bulls and bears.
But do not be confused. Just because they are called indecision candles, doesn’t mean we can’t interpret the candles.
Most indecision candles are referred to as dojis, spinning tops, or harami candles. They are all quite similar in that they visually represent a small bodied candle on a chart.
Depending on the context, these candles can be bullish or bearish. They can even be neutral in a sideways/non-trending environment.
What we have to pay attention to as traders is the reaction. In other words, what happens next?
But before we get into recognizing strategies and examples, let’s have a quick refresher on how indecision candlesticks are formed.
How Indecision Candles Are Formed
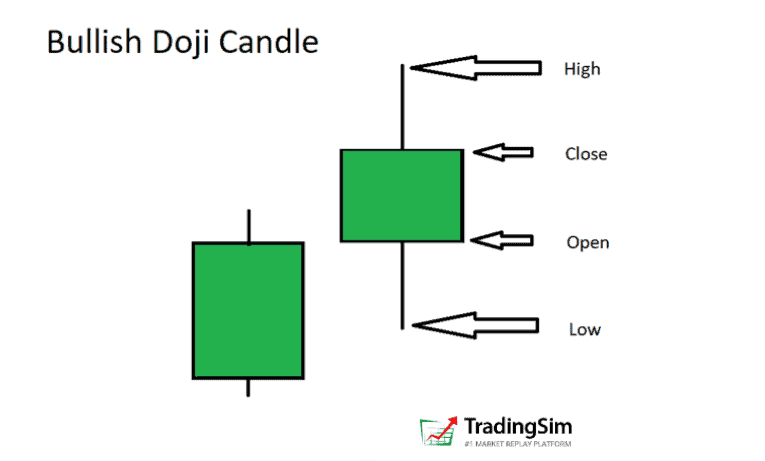
Bullish indecision candles
Here we have an example of a bullish doji, or spinning top, depending on how you want to look at it. They are generally narrow bodied candles with wicks at both ends, both of which are very important.
Why do we call it a bullish doji candle is this instance? Mainly because it close green. But we’ll dig deeper into the “why”.
Why are the wicks important?
Generally speaking, wicks at the bottom of a candle indicate demand. Wicks at the top of a candle indicate selling pressure. Why else would the price have stopped at those levels and retracted?
Of course, this is an overgeneralization as there is buying and selling going on the entire time. But this does reveal something to the perceptive trader about the character of the candle.
In short, the key takeaway is that there is no decisive close at the highs, or the lows.
As a result, what is left is a narrow body candle where the price closes near the open of the candle.
Why is the narrow body important?
Bulls and bears were both very active, but neither could gain the upper hand. The outcome of all that effort is essentially ending up where they both began.
You might call it a standoff.
In order to help visualize this, you might imagine the direction of price action as the candle forms — the natural ebb and flow of buying and selling.
Inside the formation of a bullish doji indecision candle
This can occur in either direction, up or down, as mentioned earlier. To form the body of the candle, we first get a sell off. After the sell off comes a nice bullish rally. However, as the bulls lose steam, bear regain some control into the close of the candle with selling pressure.
The candle closes green, so we call it a bullish doji.
Here’s another example in the opposite direction, just to stay well-rounded:
Inside the formation of a bearish doji indecision candle
This time the bulls start out in control and push the price of the stock higher. Unfortunately for them, there is a huge selloff as supply outweighs demand. But towards the close, there is a glimmer of hope for the bulls as they rally back.
Because this candle closes ready, however, we’d call it a bearish doji candle.
If you think of it in terms of “who is in control,” it can really help tell the story. If the open price is your typical average price paid, once the price dips below that level, the buyers at the highs are now under water.
What happens?
Bears take advantage of their vulnerability, slamming the price lower by shorting, as bulls sell, sell, sell.
On the contrary, once the price reaches an “oversold” level, bears start taking their profits and bull start coming back to buy at lower price. Thus we have a rally.
But overall, the big picture is that there was a lot of buying and selling going on. But no one has a clear upper hand by the time the candle is closed.
Now that we have covered the basics of what Indecision Candles are and how they are formed. Let’s look at some examples of the types of indecision candle patterns you might run into while trading.
4 Bullish and Bearish Indecision Candle Patterns
In these sections, we’ll look at two types of doji candles, the Dragonfly Doji and the Gravestone Doji. We’ll also examine the Spinning Top and Harami candles.
Visually, it is long narrow wick, with a very narrow base at the bottom. There is virtually no body in the candle. Imagine the side profile of a gravestone. This is it’s namesake.
Similar to other dojis, the price of the opening of the candle is almost identical to the close. Only this time, the open was at the very low.
As the candle forms, it pushes higher, only to find exhaustion at the highs. Consequently the price collapses on itself and closes where it started.
Context
When you find a Gravestone Doji in an uptrend, what is it telling you? If price is being pushed higher in the trend only to reverse on itself, that is weakness, right? We can call this a bearish Gravestone doji candle.
Let’s look at an example with JMIA on a 1-minute chart:
JMIA intraday chart with Gravestone Doji Indecision Candlestick Pattern
Now, you’re probably thinking, “why do we call it an indecision candle if it is a possible reversal pattern?”
Again, it all boils down to context, context, context.
In this example, pay close attention to the trend. Then narrow your focus on the volume signature associated with the Gravestone Doji candles. Note how elevated the volume is there compared to the rest of the candles on the chart. That’s the context you need: effort versus result.
The effort comes in to push the stock price higher, but it reverses on heavy volume.
Where Should You Enter?
Because these are indecision candles, we need to wait for confirmation. Imagine if you had taken the first Gravestone Doji to the short side in the example above. You would have been stopped out.
Sometimes it is better to wait for a close below the bearish doji, a nice red candle, to confirm our thesis. In the example above, we don’t get that red close until the second Gravestone candle.
Now, what if you spot one of these in a down trend? Would you consider it strength or weakness? A bullish or bearish doji candle? Think about it for a moment. Price tries to rally, but it gets shoved back down.
Let’s look at an example:
JMIA intraday Gravestone Doji candle explanation
As you can see, it is all about the context, and all about the story behind the price and volume. Price tries to rally. However, it falls short after the Gravestone Doji dashes the hopes of the bulls. Thus, the downtrend continues.
For our entries, we wait for the close of the doji, and sell short on a close lower in the next candle or two. As always, set a stop at the high of the Gravestone Doji, or in the body of the wick.
2. Dragonfly Doji
The Dragonfly Doji is essentially a Hammer Candle, but with a narrower body. It can also be a bullish or bearish doji candle, but is considered the opposite pattern to the Gravestone Doji. For this reason, we’ll call it bullish.
As an indecision candlestick pattern, it has all the same qualities we have mentioned for the Gravestone Doji. Only this time, in reverse.
Selling pressure comes in, creates a long tail/wick, then buyers show up to raise the price of the stock.
Why is this indecision? It all has to do with context.
Context
Let’s suppose we are in a downtrend. Sellers appear to be in control. However, we are surprised when the price begins to reverse, culminating in a bullish Dragonfly Doji pattern.
Such is the example with BABA below. We call it indecision because we are at a crossroads. Bears were firmly in control. Now, we aren’t sure anymore.
The answer lies in what comes next.
BABA Dragonfly Doji indecision candlestick pattern
Clearly, bulls took advantage of the situation, and ultimately took control by reversing the trend.
Where Should You Enter?
Like the Gravestone Doji, you want to wait for a nice close to confirm the reversal. In this instance, we might weight for the next candle, or the second thereafter to break higher.
Stops can be set in the body of the Dragonfly Doji or lower depending on risk tolerance.
Dragonfly Dojis can show up in mid trend as well, offering opportunities to add to positions.
On the same intraday chart (BABA) from above, we see the healthy trend that followed our initial reversal. Take a moment and study this next chart to see how the handful of dojis we’ve pointed out lead BABA to higher prices.
BABA series of Dragonfly Doji candlestick patterns
Effectively, they are areas of indecision that resolved higher.
3. Spinning Top
According to IG.com, the Spinning Top is known most often as a continuation pattern. The concept being similar to other indecision candles in a trending environment.
However, there are times, according to context, that the Spinning Top can signal a reversal of trend.
Bullish and bearish Spinning Top candlestick patterns
As with most candlestick patterns, there is a bullish and bearish version to the Spinning Top. For a detailed explanation, be sure to revisit our discussion and slides above.
In short, for a bullish Spinning Top, it has to open, move lower, rally, and then close green. Flip this sequence for the bearish Spinning Top.
Let’s stick with our analysis of BABA and see if we can uncover a few Spinning Tops in the trend.
Context
Firstly, we notice that a bullish Spinning Top forms immediately after the bullish Dragon Fly doji candle at the bottom of the down trend. What is this telling us?
Look closely at the body of the three doji candles in secession at the bottom of the chart in the example belowe. Note that their opening and closing prices are all extremely close together. You have an Inverted Hammer, followed by a Gravestone Doji, followed by a Spinning Top.
Talk about indecision! Would these be bullish or bearish dojis?
What we see is that the bulls and bears were fighting to win this price level, judging by the tightness of the candle bodies and their closing prices. Bulls were defending this level heavily, while bears were trying to push it down.
Thus, the indecision on whether not we would go lower.
BABA bullish Spinning Top indecision candles
Thankfully for the longs, after the Spinning Top, the price moves decisively and violently higher on heavy volume, signaling our long entry. Now, we can decisively say it was a bullish doji pattern.
Secondly, we see another Spinning Top in the middle of the uptrend. What do we make of this? After all, we have been trending upwards. Could this be a reversal? Or, just a pause in the trend?
Perhaps you have some profit taking, but the trend doesn’t seem very extended. Let’s call this a pause, and look for a real Spinning Top reversal.
WATT gives us such a reversal with a spinning top on the intraday 1-minute chart in this example:
WATT Spinning Top reversal bullish doji
Where Should You Enter?
Ideally, the entry is on the break lower as the second candle forms and surpasses the Spinning Top body and wick. Some may wait for the close of that candle to confirm, others are willing to enter early and risk above the Spinning Top.
4. Harami
The Harami is a unique candlestick pattern. It can be a reversal or a continuation, though usually thought of as a reversal.
The name comes from the Japanese word for “pregnant.” Evidently, the Japanese thought the pattern resembled a pregnant woman.[efn_note]Chen, J. (2020, January 17). Bearish Harami Definition. Investopedia. https://www.investopedia.com/terms/b/bearishharami.asp#:%7E:text=%E2%80%9CHarami%E2%80%9D%20is%20the%20Japanese%20word,use%20as%20a%20trading%20signal..[/efn_note]
Along those lines, the Harami candle is a narrow body candle that is an “inside” candle. Hence the allusion to a baby in the body of the larger candle.
For a bearish Harami candle, the body of the Harami must be a bearish or red/black doji candle immediately following a longer bodied bullish candle.
In contrast, the bullish Harami doji must be bullish/green and close inside a large bodied bearish candle.
Context
By now, you should understand what context will likely matter for the Harami, or any doji candlestick pattern. What do we look for?
Trend: up, down, sideways?
Volume signature
Extended? Oversold or overbought conditions?
Time frame?
These are just a handful of important criteria you will always want to consider when analyzing the efficacy of the pattern.
For example, if it is a bullish Harami pattern, is the stock in an oversold downtrend with a high volume spike signaling a reversal?
Or, is the stock in the middle of a young uptrend and only consolidating?
For the first example, lets look at FSR. After a steady decline followed by a massive flush on heavy volume, price pauses. It pauses inside the bearish red candle signaling indecision.
Price pauses then reverses with this FSR bullish Harami doji candle pattern
You expect price to continue lower after such a bearish red candle. Yet, to the surprise of the bears, the downward momentum is stopped and reversed.
It would be safe, then, to assume that the supply in that red candle was either absorbed, and/or no more sellers were present thereafter, sending the stock price higher.
On the flip side, you can find the exact same pattern as a bearish reversal at the top of an uptrend.
To switch gears on this pattern, let’s examine a continuation pattern with a bearish Harami pattern. The peculiar nature of this example is that it isn’t actually “bearish” for the overall trend. The name simply implies that there is a bearish/red Harami doji candle inside a bullish candle.
Bearish Harami in an otherwise continuing uptrend
You might be thinking, “Great, how confusing!”
But before you toss up your hands, remember that it is all about context, as we have been belaboring in each of these examples. Reversals are different from continuation patterns, and you’ll need to understand both in trading.
Here is the mirror image for a down-trending context:
TSLA bearish Harami candle continuation pattern
When Should You Enter?
For the Harami, you obviously want to pick the direction of the prevailing trend, or the new direction of the reversal. To do this, you need to wait for the confirmation.
In other words, is the Harami candle broken to the downside, or the upside, and what is the context. For a reversal long, take the next candle that breaks the upside of the Harami and set your stop below the Harami.
For a continuation downward, just reverse that process.
More Strategies For Trading Indecision Candles
These can be great patterns to play with the ABCD strategy. Be sure to check out our webinar on this explosive pattern!
For more on Haramis, our in-house trading expert Al Hill covers a handful of strategies in this fantastic tutorial.
How To Practice Indecision Candle Pattern Recognition
As with any trading strategy, experience is paramount. Do you have time to sit in front of the markets every day? If so, how many of these patterns will you be able to find? How long will it take you to master the patterns?
To that end, simulated training can supercharge your pattern recognition skills. Deliberate practice on your own time, coupled with analysis of your trades, are the most efficient method for learning volume and price analysis.
With enough practice, you might just find yourself an expert at discerning bullish and bearish doji candles like Gravestones, Dragonflies, Spinning Tops, and Haramis.
The recent weeks have been the scene of a worldwide health crisis that has drastically impacted the stock markets and global economic growth. The Coronavirus (COVID-19) spread from China into a worldwide pandemic and caused an unprecedented stock market crash in February 2020. The S&P 500 has experienced a collapse of about 35.5% in almost 30 days. As has said Joseph Stiglitz, Chief Economist at the World Bank,
This is a different kind of crisis than normal crises. It’s just not a problem of aggregate demand.
We will discuss the COVID-19 pandemic and its impacts on global economies, and ultimately how this pandemic was responsible for the 2020 stock market crash. I will focus on the following:
Lessons learned, expectations, and projections of this crisis, not only on the stock market but also on world economies.
We will also analyze the potential changes that will appear in the aftermath of the crisis.
Reactions of governments and international institutions in response to the crisis.
Finally, we will present the reaction of some advanced economies to this health crisis.
Before discussing these points, let us first talk about how the COVID-19 pandemic started and how it spreads the world.
What are the main causes of COVID-19 pandemic and how does it happen?
Several scientific papers document that the coronaviruses were first discovered in the 1930s in domestic poultry and usually cause respiratory, gastrointestinal, liver, and neurological diseases in animals. Only 7 coronaviruses are known to cause disease in humans. Four of the 7 coronaviruses most often cause cold symptoms. The COVID-19 pandemic is an ongoing pandemic characterized by acute, sometimes severe respiratory disease in humans. This is caused by a new coronavirus SARS-CoV-2.
There exist other kinds of coronaviruses such as MERS-CoV which was identified in 2012 in the Middle East, while SARS-CoV-1 was identified earlier in different regions around the world. The new Coronavirus that the world is experiencing is an advanced version of the SARS-CoV-1. It was identified in December 2019, in the city of Wuhan, in China. According to the international society of infectious diseases (ProMED), more than 677 570 cases have been identified in the U.S.A, on April 16, 2020, with a mortality rate of 5.1%. The situation is nowadays less pronounced in China.
The COVID-19 has been characterized by Zhu, Zang & Wang (2019) and they show that SARS-CoV-2 is 75 to 80% identical to SARS-CoV and is closely related to bat coronaviruses. That’s why bats are considered as the primary vector for the virus. It can also be identified in animals like cats, camels, and cattle. This is usually called zoonotic transmission. According to researchers, a large majority of people who got the disease early on were linked to a live seafood and animal market in China.
What are the mechanisms of the Coronavirus transmission from one to another?
The first cases of COVID-19 may come from animals sold in the market and has mainly spread from person to person (see Sabir, Lam, Ahmed et al. (2016)). Usually, SARS-COV-2 spreads when an ill person coughs or sneezes. Sick persons can emit saliva from their mouth at 6 feet from their position. If you inhale them, it is possible to get the virus and get sick.
Another way to get the virus can come from touching an infected object or an infected person and therefore touch your mouth or nose. Several papers demonstrate that the COVID-19 can live for more than 4 hours on different types of objects. We can notice a lifetime of 4 hours on Coppers, 24 hours on Cardboards, and up to 3 days on Plastics.
Researchers have also documented Airborne transmission (demonstrating that the virus can live in the air for 3 hours and if you breathe the infected air, you can get the virus) and fecal-oral transmission (showing that virus particles can be founded in sick people’s poop).
Studies have also documented the possibility to get infected by COVID-19 even if one has not traveled or has not been exposed to a sick person and it’s not possible to identify the source of the infection. This is usually called the “community spread”. These cases have been identified in California.
There are also people who do not manifest the symptoms of the virus but can also be a vector of transmission. The risk of infection of the Coronavirus can increase with age. Children are less likely to be exposed to the virus, while people of over 65 are most likely to get severely sick. Also, people working or living in hospitals, or having a weak immune system are highly exposed to diseases. For example, people suffering from severe obesity, diabetes, asthma, cancer, heart diseases, etc.
What is the current situation of the coronavirus pandemic around the world?
According to the website Worldometers, at the date of April 17, 2020, more than 2,232,627 cases of COVID-19 have been identified with 153,296 deaths and 568,231 recoveries, which represents a mortality rate of 6.8% and a recovery rate of about 25.4%. The statistics from the World Health Organization (WHO) are slightly similar. Up to 113 countries, areas, or territories are concerned by the virus.
Europe and North America are the most affected zones in the world with 45% and 33.5% of confirmed global cases respectively, while Africa and Oceania are the less affected continents representing 0.9% and 0.35% of the global cases respectively. Even if Asia is the continent where the virus took-off, it’s only the third continent affected by this virus, representing only 15.9% of the global cases.
In terms of deaths, Europe and North America registered the largest number of death in the world which represents 62.4% and 25.5% of the total deaths respectively. In contrast, Africa and Oceania registered the lowest number of deaths, which is 0.66% and 0.05% of the total number of deaths respectively.
Table 1: Comparison of the number of cases and deaths per continent (our calculations with the data of the website www.worldometer.info, April 17, 2020).
United States of America (USA) is the most widely affected country registering 31.3% of the total cases in the world and 24.1% of the total number of deaths. It is followed by Spain (8.4% of the total number of cases and 12.7% of the total number of deaths) and Italy (7.7% of the global number of cases and 14.8% of the global number of deaths).
We can also notice that 7 of the 10 most-affected countries in the world are from Europe, two are from Asia and the USA is the only one representing significantly the whole American continent. Ten countries represent 77.5% of the total number of confirmed cases in the world with 86.7% of deaths registered in the world.
Table 2: Comparison of the number of cases and deaths for the 10 most-affected countries (our calculations with the data of the website www.worldometer.info, April 17, 2020).
Concerning the distribution of COVID-19 since December 31, 2019 to April 17, 2020, it can be observed that the number of confirmed cases has experienced an exponential evolution with an upward sloping shape from December 31, 2019 to April 01, 2020 but started to flatten since the beginning of April as reported in the following figure by the European Centre for disease prevention and control.
At the worldwide level, we are still on the upward sloping shape either in terms of the total number of cases or in terms of the number of deaths.
Figure 3: Evolution of the COVID-19, Worldwide, up to April 18, 2020 (www.worldometer.info).
How has the Coronavirus pandemic affected the Stock Market and world economies?
With the outbreak of COVID-19, global stock markets have experienced a severe crash, beginning February 20, 2020 and lasting thru March 23, 2020. This global market crash is comparable to the Great depression in 1929, in the USA. Starting February 20, stock markets around the world registered the largest weekly decline since 2008. Global demand shocks and the crashing oil markets (due to the conflict between Saudi Arabia and Russia due to Russia’s refusal to curb oil production) has been another catalyst that led to a serious increase in the volatility and reaction in the stock market.
With the multiple risk factors of the Coronavirus pandemic, almost all the countries in the world have decided to impose a massive worldwide lockdown in order to enforce social distancing. A large majority of companies have shut down with employees working from home. Only some essential services are open to the public such as groceries, restaurants with delivery services or curbside pickup, hospitals, and doctors offices.
When taking a look at the main observed indexes in the global stock market, we can observe that the S&P 500 observed a drop of about 35% in almost 1 month. The Dow Jones has experienced a drop of 36%, which is approximately 10760 points loss for the period February 20 to March 23rd, 2020. The CAC 40 and Dax 30 are under pressure in Europe dropped by almost the same rate, which is 38% in the same period. The FTSE 100 in Japan has reported a collapse of 30%, while in India, the Nifty index dropped by almost 50%.
Figure 4: Evolution of the most observed indexes in the stock market during the crash 2020 (Google Finance)
The volatility index (VIX) has exploded and increased 432% during that period, signaling total panic in the markets. This explosion of the volatility was rapidly followed by a quick drop starting by March 23, 2020.
Figure 5: Evolution of the VIX and Dow Jones during the stock market crash 2020 (Google Finance)
The airline sector has suffered tremendously. Airline companies around the world have canceled their flights. Shares of United Airlines and Delta Airline were down by more than 50%.
The International Air Transport Association (IATA), reported that worldwide airline passenger traffic will fall by 48% for this year due to the coronavirus pandemic. Projections estimate losses of $314 billion in revenues due to the severity of the COVID-19 pandemic, as business travel demand dropS and government travel restrictions increase. More specifically, Asia is projecting a loss of 50%, while Europe and America are estimating a 55% and 36% loss in passenger traffic compared to the third quarter of 2019, respectively.
Additionally, the World Trade Organization is projecting in the best-case scenario of about 12.9% and the worst-case scenario a drop of 31.9% in air cargo volume for this year. Furthermore, the industry is experiencing a liquidity crunch, with a cash burn of about $61 billion for the second quarter of 2020.
In contrast to the airline industry, essential industries, are more resilient to the 2020 stock market crash. As essential industries, we have Health care, Food, basic transportation. Indeed, goods and services produced in these industries are more inelastic in the sense that the aggregate demand does not change significantly even if the economy is in recession.
For example, Vertex Pharmaceutical (VRTX) has reported an increase of 24% since January 2020. On the same line Walmart (WMN) and Kroger (KR) have gained an increase of 12.25% and 11.45% in the same period respectively.
Figure 7: Some resilient stocks during the stock market crash 2020 (Google Finance)
Additionally, even if online-based companies such as Zoom (ZM), Amazon (AMZN), Netflix (NFLX), eBay (EBAY) have been impacted by the crash during the period February 20 – March 23, those companies have reported a quick recovery of their drawdown. For example, Zoom (ZM) has gained an increase of 42% since the beginning of the 2020 stock market crash. At the same time, Amazon (AMZN) and Netflix (NFLX) have gained 10.31% and 9.52% respectively. The other stocks I mentioned also follow the same pattern.
Where are we now and what can we expect going forward for world economies ?
According to the International Monetary Fund (IMF), the global economy will experience the worst recession since the great depression and this is the first time where developed economies and developing countries are in a recession.
Indeed, with great lockdown, the world economy may expect a decrease of global growth rates by almost 3% during the second quarter of 2020, representing a downgrade of 6.3 percentage points from January 2020, which is 30 times the effect observed during the global financial crisis in 2008 – 2009. These projections assume that the majority of countries in the world will experience their peak in terms of pandemic spread during that period.
In the best-case scenario in which the pandemic widespread is efficiently controlled, it can be projected that the United States, Eurozone, and Japan will experience a decrease of their GDP growth rate by 6%, 8%, and 5% respectively, while China and India might be the beneficiary of this crisis, reporting a positive GDP growth rate of almost 2% in 2020 (see IMF world Economic Outlook ).
In the worst-case scenario with more uncertainty in the controlling procedure of the health crisis, one may expect an additional loss of 3 percent for this year and eventually a fall of the world GDP growth rate of 8% in 2021 if the virus persists and this with hurt the financial conditions of all the countries around the world with the drastic increase of the global unemployment rate. These results were expected as it has been documented by Wang, Yang & Chen (2012).
Indeed, the authors document that a contagious disease doesn’t only affect the health and lives of people but also leads to economic growth stagnation, but it can produce abnormal returns in the biotechnology sector. On the same line, the European Commission produced a previous report estimating the macroeconomic effects of a pandemic in Europe using a quarterly macroeconomic model (see Jonung and Roeger (2006)). Indeed, the European Commission shows that the effect could experience a GDP growth rate drop in the range of 1.6% – 4.1%. Similar studies have been done for the United States, Canada, Germany.
Concerning Sub-Saharan Africa countries, it is expected that the COVID-19 pandemic will lead to a decrease in the GDP growth rate and that could reach the range of -2.1 to -5.1% in 2020. This is evaluated as an output loss between $37 billion and $79 billion, including trade and value chain. Additionally, this crisis could affect also the food security by reducing agricultural production by up to 7% and a decrease of good importation by up to 25% (See World Bank press release April 9, 2020). The oil exploitation and tourism sector have been also affected due to the severe reduction of external demand.
What are the expected long term major changes in the economy?
With the object of respecting the social distancing, the great lockdown has imposed a large majority of the population to stay at home. This sudden stop of the economy has pushed people to seek new ways to connect and hang out with their family and friends and even to connect with business partners.
On the same line, companies are looking for new ways to run their business. Video chat is taking off especially in America and Europe. For example, applications such as Google Duo, Nexdor, and Houseparty are experiencing a huge increase in their traffic (see Similarweb).
Indeed, these applications have gained an increase of 12%, 73%, and 79% respectively, in daily traffic since January 2020. On the same line, the new way to teach classes in schools is by using applications such as Zoom, Google Classroom, Microsoft Teams, Google Hangouts.
On the other hand, applications for delivery services such as Uber Eats, GrubHub, Delivery.com, Postmates, DoorDash, Caviar have also gained in terms of usage as the on-demand food is expected to increase and be a $365bn industry.
Applications for entertainment such as Facebook, Youtube, Netflix, and Whatsapp have also gained in terms of utilization. We expected that these internet activities will increase significantly in the aftermath of the crisis.
How to fix the 2020 stock market crash according to the economic theory and what are the government’s reactions?
As we already know, the infectious diseases do not affect only the health and lives of peoples but also the whole economy of all countries around the world, we expected governments to react at the macroeconomic level and response proportionally to the sectors suffering from this Health and Economic crisis. More specifically policymakers should think about not only monetary policies but also policies encouraging public spending in order to encourage the private sector to produce but also to stimulate aggregate consumption.
Indeed, according to the popular Taylor rule, in order to encourage production, Central banks should cute the interest rate so that private firms can take more credit and invest more and therefore recruit more employees. By increasing of employment rate it will lead to an increase in consumption. To boost more this approach, Central banks usually print more money in the economy by buying assets from the private banks and short term bonds from governments. This is called quantitative easing.
These strategies become more important when it is observed that the short term interest rate is closed to zero. This is the situation that most of the advanced economies are experiencing. Indeed, the interest rate in the United States and Canada is almost the same and is currently evaluated at 0.25%. We can observe lower rates and even negative rates in Europe. For example, the short term interest rate in France was reported at -0.36% in March 2020. Almost the same rate is observed in Italy, Germany, and other countries in the EURO Zone.
Additionally, policymakers in advanced economies have planned a recovery strategy which is mainly based on implementing a fiscal stimulus program. The main goal of this policy is to guarantee that even if there is a drastic increase in the unemployment rate, the aggregate consumption in the economy is sustained at a certain level. Currently, the United States, Canada, France, the United Kingdom, and Germany have already decided the amount to deploy for this program. For example, in the United States, Congress decided for a budget of $2.3 trillion stimulus bill to address the COVID-19 pandemic. In Canada, the budget for this purpose is evaluated at $75 billion. The main idea of this fiscal program is to offer a direct cash payment of $2000 per month during the pandemic period to all eligible persona and small businesses. In France, the package is evaluated at $49 billion, while in the United Kingdom the government is promising a budget of $430 billion and $810 billion in Germany.
Aside, the International Monetary Fund (IMF) is planning a lending capacity of $1 trillion to support the different vulnerable countries from this crisis and are encouraging official bilateral creditors to support their partners for these circumstances. Indeed, some bilateral creditors have prolonged the payment deadline of poor countries in response to this crisis Furthermore in direction of the developing countries and especially for sub-Saharan Africa countries, the World Bank deployed up to $160 billion in financial support for the next 15 months to reinforce their response to the COVID-19 pandemic. This financial support is mainly oriented to help vulnerable businesses and improve the public health reaction.
Conclusion
The pandemic is still ongoing and the uncertainty of the world economy and the stock markets is huge for these recent weeks. Even if we started to see a recovery in the stock market, the panic is still in the market with overreactions of market participants.
The airline industry is one of the most affected sectors while the biotechnology and tech industries are less affected. Moreover, China and India are the countries that will benefit the most from this crisis.
The governments in the advanced economies are already implementing the stimulus package. The problem is that this policy can only hold in the short term and not in the long term. This means that if there is more uncertainty in the world in terms of this pandemic duration, the economy can suffer more and we can have a second phase of the world recession and stock market crash.
Another concern is the capacity of developing countries to address this health crisis and economy recession as their economy is highly dependent on the importation, tourism, and oil price.
In overall, it is expected that all the countries would definitely experience a significant increase in the economy digitalization.
The recent downturn in the stock market has many investors concerned about a prolonged bear market. The Dow Jones recently plunged to its lowest levels since the “Black Monday” stock market crash of 1987. How did the bull run of the 2010’s come to end in 2020? And what does this current bear market mean for investors?
Bear Market
What is a bear market?
Before the bear market of today, the original bear market reportedly got its name from fur salesmen in colonial times. Investopedia noted that the bearskin sellers were similar to stock traders of today.
“Historically, the middlemen in the sale of bearskins would sell skins they had yet to receive. As such, they would speculate on the future purchase price of these skins from the trappers, hoping they would drop. The trappers would profit from a spread — the difference between the cost price and the selling price. These middlemen became known as ‘bears’, short for bearskin jobbers, and the term stuck for describing a downturn in the market,” noted Investopedia.
Today, a bear market definition is much different. A bear market is a time when major stock indexes drop from a high point by 20% for an extended period.
When was the longest bear market?
The worst bear markets occurred during the Great Depression in the 1930’s. During that time, the Dow Jones cratered by almost 34% after a decline in stocks. Many investors bought the stocks on margin, borrowing funds from brokers. When stocks fell and investors couldn’t pay back their loans, there was a run on banks. The resulting bank runs and uncertainty about the economy led to the great stock market crash of 1929. That subsequently led to the Great Depression that lasted for about a decade until the U.S. entered World War II in 1941.
When did other bear markets in history occur?
During the 1987 crash, the markets dropped 31%. That decline was likely caused by a decline in the U.S. dollar after a widening trade deficit with Asian countries. In addition to the decline of the dollar, the new technology of program trading orders led to the crash. The then-new technology of computer trading had an automatic system that liquidated stocks after price decline targets were met. However, the sell-off led to more panicked selling and stop-loss orders.
As a result, Black Monday on October 19, 1987 led to a 22.7% loss in the S &P. After Black Monday, circuit breakers were put in place on Wall Street. Once losses reach 7%, traders have time to stop trading to prevent the Dow Jones from falling further.
The latest bear market in 2008 saw the markets decline by almost 25%. The last bear market was during the 2008 Great Recession. The Great Recession started after banks started failing after a previous boom in the early 2000’s.
Banks started failing after many low-income homeowners couldn’t pay their subprime mortgage loans after adjustable interest rates rose. Ironically, banks pushed these high-risk loans to consumers that ultimately led to their decline. Homeowners defaulted on their loans and the housing bubble burst. Once the housing market and banking industries tumbled, the Dow Jones fell by double digits. The Great Recession lasted from 2008-2009.
How has coronavirus caused the latest bear market?
Coronavirus
Less than a month after hitting a record high of 29, 551. 42 on February 12, the Dow Jones sank 28%. The Dow Jones plummeted to 21,200. 62 on March 12. Fears about the spread of the coronavirus ( COVID-19) pandemic have caused a massive sell-off. The pandemic caused panic since February by spreading from China. The country is inextricably connected to the U. S. because of how many American goods are produced in China. The illness has spread to Europe and to America, with the world’s largest economy. Many other nations around the world have been impacted by the coronavirus.
Over 118,000 people have been diagnosed with coronavirus worldwide. The virus has claimed about 4,800 lives so far. The illness is apparently spread through large crowds. In the reaction to coronavirus has led to a global shutdown of nations affected, especially China and Italy. Coronavirus has caused the cancellation or slowdown of sporting events, travel, and other activities. These social activities that are driven by consumer spending throughout the globe are being disrupted.
The worries about the virus have caused a drastic downturn in trading. There was a halt in trading at the New York Stock Exchange for 15 minutes on several days the week of March 9 because stocks fell so low. The S & P 500 fell 10% on March 12 and triggered a “circuit breaker” that was supposed to halt trading and prevent a further decline. However, the Dow Jones continued to tumble and dropped 2,353 points on that one day alone.
Oil price war adds to Wall Street volatility
In addition to the coronavirus crisis, there have been wild swings in the stock market. The Dow Jones is rattled because of an impasse between Russia and Saudi Arabia, two of the world’s biggest oil producers. Russia refused to honor an agreement from the oil-producing countries of OPEC ( Organization of Petroleum Exporting Countries.) OPEC initially agreed to cut oil production by 1.5 million barrels a day to drive up prices. Russia refused to go along with the Saudi-led deal. As a result, Saudi Arabia increased its oil production and flooded the market.
Crude oil prices dropped 24% in response to the ramp-up of oil production. That decline was the worst since the start of the Persian Gulf War in 1991. The drop in oil prices led to more volatility on Wall Street. Foreign Policy columnist Jason Bordoff noted that Saudi Arabia could have an advantage over Russia in the oil price war.
“The problem for the kingdom is that Russia is more resilient to lower prices than it is, having added considerably to its foreign exchange reserves while Saudi Arabia’s fiscal cushion has dwindled since the 2014 oil price collapse,” wrote Jason Bordoff.
U.S. responds to global oil war
In response to the oil price war, President Donald Trump has ordered the U.S. Department of Energy to buy crude oil for the Strategic Petroleum Reserve. Trump made the decision after oil company stocks like Exxon and Chevron have plummeted by double digits. He also made the decision after crude oil prices dropped worldwide.
“Based on the price of oil, I’ve also instructed the Secretary of Energy to purchase at a very good price large quantities of crude oil for storage in the U.S. strategic reserve,” Trump said.
“We’re going to fill it right up to the top, saving the American taxpayer billions and billions of dollars, helping our oil industry [and furthering] that wonderful goal — which we’ve achieved,” added Trump.
The twin troubles of coronavirus and the decline in oil prices have led to volatility on Wall Street that ends the longest bull market in history.
Why did the bull market start?
The bull market ended after an impressive run before falling into a bear market. While the bear market comes when the market falls 20% below a peak, it’s the polar opposite of a bull market. The term bull market probably comes from the belief that bulls always charge upward with their horns. Therefore, when the stock market is doing well for an extended period of time, that is a bull market. A bull market means that the Dow Jones rises 20% above its current peak for an extended period of time. The latest bull market ran from 2009-2020.
Before the recent volatility, the Dow Jones was enjoying a record run of prosperity. The stock market rocketed 20% above its last peak in March 2009 and has soared ever since. The recent bear market ends the longest bull market that started in the spring of 2009.
How did the Fed help drive the bull market?
As the U.S. was surviving the Great Recession, the federal government’s $700 billion bank bailout helped revive the economy. In addition to the bank bailouts, the Federal Reserve helped lay the groundwork for the 2010’s bull market. The Federal Reserve spent $1 trillion on mortgage and government bonds to enable quantitative easing. The move pushed interest rates lower and enabled consumers to take out more bank loans and investors to buy more stocks.
The Fed also kept its federal funds target rate at a rock-bottom rate of 0%-0.25%. The federal funds target rate is the rate depository institutions charge for overnight lending to banks. That low rate empowered banks to borrow money at low rates and increase their profits.
In addition to the Fed’s dovish policy that led to helping businesses, the 2017 Tax Cuts and Jobs Act also boosted stocks. The business-friendly tax cuts helped lower the tax rate of corporations. Corporations participated in stock buybacks, which boosted companies’ stock prices.
As a result of all of those factors and a robust economy, Wall Street enjoyed 10 years of a skyrocketing economy amid rising stocks. As a result of the longest bull market, the S&P rose 330% over the last 11 years.
Why did the bull market end?
While the bull market had a long run, even before the coronavirus crisis, there were low points to the bull market wave. The recent Brexit controversy in the United Kingdom in 2019 temporarily caused a dip in the markets. Uncertainty about the United Kingdom leaving the European Union led a short-term dip in the global markets. The U.S.-China trade war started by President Trump also led to market volatility in 2019 as well. The U.S. and China engaged in a stand-off over tariffs led investors to worry about how international trade would be impacted.
With the latest volatility in the stock market, the bull market has officially ended. Coronavirus accelerated the Dow Jones’ decline. Just a month after reaching a record high, the Dow Jones has lost $6.7 trillion in value in the latest bear market. A mixture of a global economic slowdown and investor worries have led to a massive stock sell-off. The official end to the bull market was during the week of March 9.
What is the Fed’s response to the bear market?
Now that the Dow Jones in a bear market, many investors are watching to see what actions will be taken. In response to the Wall Street crash, government agencies are taking action again. The Federal Reserve lowered interest rates in an attempt to revive Wall Street. The U.S. central bank pumped up stocks by lowering its fund target rate to 0% in 2009.
Now the Fed is taking action a similar again a decade later. The Federal Reserve will cut interest rates down to the range of 0%-0.25%. That comes after concerns about the markets tanking the week of March 9. The Fed will also launch a $ 700 billion quantitative easing program. The Fed’s quantitative easing will be comprised of $500 billion of Treasury purchases. The Fed will also distribute $200 billion in mortgage-backed securities.
The Fed released a statement before lowering interest rates.
“The coronavirus outbreak has harmed communities and disrupted economic activity in many countries, including the United States,” noted the Federal Reserve.
The Federal Reserve added that it is making it easier for banks to issue loans to consumers. The U.S. central bank wants to help banks loan more to Americans. The Fed noted that it “is prepared to use its full range of tools to support the flow of credit to households and businesses and thereby promote its maximum employment and price stability goals.”
“These purchases are intended to address highly unusual disruptions in the market for Treasury securities associated with the coronavirus outbreak,” said the New York Fed in a statement.
The New York Fed will offer banks $1 trillion in loans in exchange for Treasury bonds.
“If the market feels the Fed is responding appropriately and is helping investors and consumers, and feel like somebody is in charge, maybe that can help settle things down,” said Delwiche.
While the action was meant to help the stock market, the bank assistance from the Federal Reserve has had a mixed effect. As of the week of March 16, the Dow Jones still shed another 1,000 points. However, by March 17, the market jumped 1,000 points. By March 18, the Dow dropped again, losing over 2,000 points.
What will be the government’s response to the bear market?
Government Response to Bear Market
The Trump administration is taking action to help boost the stock market. The government will offer paid leave to workers who have to stay home under quarantine. Congress is also in negotiations with Trump to offer a stimulus to help boost the Dow Jones. There will possibly a $1 trillion stimulus package that will give $1,000 to each American worker that has to work from home.
Some financial experts want the government to act more urgently to stop the bleeding on Wall Street. Joe Kalish, chief global strategist at Ned Davis Research wants the government to immediately pass a stimulus package to help the Dow Jones rebound.
“We need to see meaningful support for economic activity and credit backstops especially for small businesses, not a targeted approach executed only by the executive branch,” noted Joe Kalish.“We will likely need congressional involvement. This is a potential solvency problem.”
Should investing in a bear market include “buying the dip”?
Regardless of whether there is government intervention or not, investing in a bear market can either be financially savvy or a financial disaster. Many investors are encouraged to “buy the dip” and buy stocks during this huge sell-off. Buying the dip is buying stocks during a bull market when stock prices are lower.
Some financial experts like David Mazza say investors should buy the dip. The trading expert says investors should invest in stocks when they drop in a bear market. However, Mazza advises that investors should invest in a bear market under certain conditions. Mazza says investors should buy the dip only if they’re optimistic that the stock market will bounce back later.
“From a longer-term perspective, valuations across the market just got a lot more attractive. For investors that do not believe this will lead to a true 2008 type of global downturn, dipping your toes into the water does make some sense”, said Mazza.
Some financial advisors are against investing in a bull market
While some financial experts advocate being a bear investor, others are more hesitant. Mohamed El-Erian, chief economic advisor at Allianz, cautions against investors buying stocks in a bull market. El-Erian believes that investors are in for the long-haul should exercise caution before buying the dip because of the volatilty of the stock market.
“If you are a long-term investor, I would wait. I think fundamentals are going to deteriorate even faster. I think the policies and fundamentals are going to go in favor of bad fundamentals, unfortunately, initially,” said El-Erian.
Which stocks should investors buy in a bear market?
If investors want to make decisions on what stocks to invest in, there are stocks that are performing well in a bear market. Some stocks have been performing well as a result of the coronavirus outbreak. Costco ( NYSE:COST) stock has risen as shoppers have bombarded the store. They are panic shopping for items and emptying shelves to try to combat the coronavirus. The warehouse retailer’s stock surged 8% on March 13 and subscription numbers are up after shoppers rushed Costco stores.
Costco’s chief financial officer, Richard Galanti, noted that Costco members have bought many items during the coronavirus pandemic that have driven up sales.
“Members are turning to us for a variety of items associated with preparing for and dealing with the virus such as shelf-stable dry grocery items, cleaning supplies, Clorox and bleach,” said Galanti. He also noted that “water, paper goods, hand sanitizers, sanitizing wipes, disinfectants, health and beauty aids, and even items like water filtration and food storage items” are bestselling items in the stores.
Costco is selling out of Clorox ( NYSE: CLX), another stock that is performing well in a bear market. Clorox’s stock price rose by about 15% throughout 2020 as of March 13. The company that makes cleansing wipes and other disinfectant materials have been flying off store shelves in the wake of coronavirus. UBS analyst Steven Strycula believes that coronavirus (COVID-19) fears will continue to drive Clorox stock up.
“Based on conversations with retail buyers, we estimate COVID-19 related demand could boost baseline disinfectant category trends by 3-5x in the next few months as retailers work to rebuild inventory and stay in stock,” reasons UBS analyst Steven Strycula.
Working from home creates boom in Zoom stock
Another stock that has seen improvement in the wake of the coronavirus crisis is Zoom ( OTC: Zoom) . The videoconferencing software company has seen shares rise as more people are working from home. The stock surged by 24% over the last month. Zoom is continuing to show its strength a year after its IPO went public.
Zoom stock the week of March 9
What stocks should investors avoid in a bear market?
Airline stocks are performing poorly in the wake of coronavirus. Shares in those industries have tumbled as a result of the virus scare. Many people are traveling less in America and there is a travel ban from Europe. All of these factors are making airline stocks a risky investment. American Airlines (NYSE: AAL) stock is down 50% over the past month. The airlines are hoping that a $50 billion bailout from Congress will help the industry rebound from its current losses.
In addition to airline stocks, cruise line stocks are a poor option for investors. Similarly to airlines, restrictions on cruises and cancellations have hurt share prices. Cruise lines that have been breeding grounds for coronavirus have been deeply impacted. Shares of Norwegian Cruise Line ( NYSE:NCLH) have cratered by 72% since the global pandemic spread.
Norwegian Cruise Line stock the week of March 9
Restaurant stocks suffer from social isolation rules
Another industry that is struggling amid the economic downturn is in the restaurant industry. Darden Restaurants ( NYSE: DRI) stock is down by double digits. The stock of the parent company of Olive Garden has tumbled by at least 16% since coronavirus spread in the U.S. Social distancing caused many Americans to eat at home instead of eating out at chain restaurants. Many restaurants are closing around the country through state mandates, but chains like Olive Garden will remain open. Olive Garden noted in a statement that it is adding hand sanitizing locations and separating tables. Darden also said it will give paid sick leave to employees that are not well.
“We are proud of our 190,000 team members for the support they are providing to our communities. One of the most important things we can do is to care for those who care for you. Recently, we rolled out a paid sick leave policy to every one of our hourly team members, so they can stay at home until they feel better while still being compensated”, said Darden.
Despite the precautions and proactive steps to help employees, restaurant stocks like Darden are taking a hit during the coronavirus pandemic. Restaurant stocks may further decline if the stock market continues to experience volatility.
Should investors choose inverse ETF’s in a bear market?
In addition to individual stocks, ETF’s (exchange-traded funds) have been hit in the bear market. However, inverse ETF’s have become attractive in the current bear market. As ETF provider Direxion noted, the ETF’s can offer a quick return during a bear market.
“These tools may be used when seeking to hedge the market. As their name reveals, inverse ETFs go up when the market goes down, and they go down when the market goes up. Inverse ETFs allow you to seek the opposite return of specific sectors and asset classes; for instance, the S&P 500, and Financials, Energy and Technology sectors,” said Direxion.
“Again, the thing to remember about these funds is that they’ll lose value as long as the market keeps going up. But the potential rewards can be attractive if the market suffers a setback. At the very least, inverse ETFs may serve as a hedge. It’s important to note that an –1x ETF which seeks 100% of the inverse performance of an index, is subject to daily compounding. However, basic math dictates that the compounding would be less than the compounding in a -2x or -3x leveraged ETF,” added Direxion.
Which inverse ETF’s would be best for bear investors?
Some inverse ETF’s that investors may decide to invest include these top ETF’s. ProShares Short QQQ had a 26% return during the 2018 correction and has an annual dividend yield of 1.76%. Direxion Daily S&P 500 Bear 1x and ProShares Short S&P 500 also had double-digit returns during the 2018 turbulence of the U.S.-China trade war. Those ETF’s could perform well during a bear market.
What ETF’s should investors choose in a bear market?
ETF analysts believe that the ETF industry can withstand the volatility in the stock market. WallachBeth Capital’s Andrew McOrmand advocates choosing options for ETF investors. He also wants investors to research the ETF’s before choosing these funds.
“We do know very active traders that don’t use options. I think options are a great thing,” he said. “I would focus on listed options, listed index options and ETF options, but understand that vol[atility] is high and understand the pricing, meaning that you are going to pay up to put your idea on and, certainly, there’s risk in selling those ideas,” said McOrmand.
“For ETFs themselves as listed tickers, you could look at liquid alts[liquid alternative investments] like QAI and MNA, which are less correlated to the overall market and can dampen volatility,” said McOrmand.
Tom Lydon, CEO of ETF Trends, believes that the ETF’s are a safe option in the wake of the current bear market. He also agrees with McOrmand that staying calm in the face of Wall Street volatility is key.
“We’re cheering on the ETF business for sure. It’s doing what it’s supposed to do at this point. Going forward, I think [McOrmond’s] words of wisdom about being calm, sticking to your long-term model, is important. If you’re trading, make sure you’re efficient in your trading.
What should investors do in a bear market?
With the volatility in the stock market, these actions could be effective for investors. Investing in a bear market could be profitable with these strategies. Dollar-cost averaging is for risk-averse investors that want to remain steady in a bear market. Dollar-cost averaging means investing stocks at regular intervals at the same amount. This strategy can work effectively during a bear market. Investors put a certain amount into buying stocks. With a steady amount, there can be a pay-off during a bear market. If stock prices fall, your average cost can fall and investors can buy more shares of stocks.
Diversified portfolios would also be pivotal to investing in a bear market. Having a diverse mixture of stocks, bonds, and futures can help investors in a bear market. Futures can especially be an effective way to invest. Futures like the E-mini S & P 500 are one of the most trades indexes. Buying Treasury bills can be effective as well. The yields on 10-year Treasuries have skyrocketed 27.2 basis points in the past few days. Investors are likely investing in a perceived safety in Treasury bonds with the uncertainty of the stock market.
E-mini S&P Futures
Another investment strategy is to invest in stocks with high dividends. Some stocks with high dividend payouts include Big Pharma company Pfizer(NYSE:PFE) and storage company Public Storage (NYSE: PSA). These stocks often give investors high dividends of at least 3%.
Another bear market investing strategy that is effective is simple patience. Because of the volatility in the market, it’s impossible to time when the Dow Jones will enter a bear market. Riding out the wild swings of the stock market is key to investing in a bear market. By just waiting out the bear market investors can profit. Even for passive day trading, thinking carefully before investing will lead to better investment decisions.
Some financial experts see buying opportunities in bear market
While many financial advisors are pessimistic about the current stock market, investor Bill Miller says the bull market is a great time to invest. The chief investment officer of Miller Value Partners said that the bear market can be advantageous for savvy investors.
“I think this is an exceptional buying opportunity. I don’t mean to put all the money in at once but I do think layering it in right now is the way to go,” said Miller.
Financial experts believe bear market will last if no pharma breakthrough
Many other financial experts believe that the bear market will last longer than expected. Paul O’Connor, head of multi-assets at Janus Henderson Investors believes there is a medical component to the Dow Jones recovery. He says that unless coronavirus infection rates slow, Wall Street will continue to be nervous.
“The missing fundamental ingredient for a sustainable recovery in risk appetite is some evidence that the growth of global Covid-19 infection rates is peaking. Clearly, we are not there yet,” said O’Connor.
Tom Essaye, founder of the Sevens Report, also thinks that innovations in medicine is key to helping the skittish stock market.
“Volatility is not over yet,” said Essaye.“We also need to see more progress on the pharma side of things and above all else we need the growth rate of the virus to peak in the coming weeks.”
John Hill, interest-rate strategist at BMO Capital Markets, said that the government’s response is key. He believes the policies implemented will affect the stock market.
“Unless the White House and Congress significantly disappoint with their policy response, there is room for the bearishness to extend,” said Hill.
When will the bear market end?
For investors who want to be more aggressive during this bear market, there are many options. However, it remains unclear how long this downturn will last. The stock market has gone through wild up-and-down swings over the last few weeks. The S &P credit rating agency believes that the U.S. is headed toward a recession.
“The increasing restrictions on person-to-person contact in Europe and the United States have sent markets reeling as risk-aversion rises and views on economic activity, earnings, and credit quality deteriorate sharply,” S&P said in the note.
No matter what happens in the bear market, investors will be closely watching Wall Street. They will monitor what stocks they should buy or sell. The massive sell-off is part of a cycle of bull markets and bear markets. As long as investors are patient and wait out this current crisis, they can find the best stocks, ETF’s, and futures to add to increase their portfolios.


![8 Best Bearish Candlestick Patterns for Day Trading [Free Cheat Sheet!]](https://app.tradingsim.com/wp-content/uploads/2021/06/image-60.png)