The Descending Triangle Pattern- Learn 5 Simple Trading Strategies

The descending triangle pattern is a type of chart pattern often used by technicians in price action trading. The pattern usually forms at the end of a downtrend or after a correction to the downtrend. However, it can also occur as a consolidation in an uptrend as well.

Chart technicians can make use of the descending triangle pattern in order to trade potential breakouts.

Bearish or Bullish?

Contrary to popular opinion, a descending triangle can be either bearish or bullish. Traditionally, a regular descending triangle pattern is considered to be a bearish chart pattern. However, a descending triangle pattern can also be bullish. In this instance it is known as a reversal pattern.

To that point, the descending triangle can be viewed as either a continuation pattern or a reversal pattern. The triangle continuation pattern is your typical bearish formation. This pattern occurs within an established downtrend.

On the other hand, a descending triangle breakout in the opposite direction becomes a reversal pattern. Considered the opposite of the ascending triangle, this pattern is also known as the bearish triangle descending pattern.

A very important fact to bear in mind when trading the descending triangle is that it is very subjective. Therefore if you are new to trading the descending triangle stock pattern, you need to have a lot of practice. Familiarizing yourself with it in the simulator will allow you to build your own custom triangle trading strategies.

Characteristics of the Descending Triangle

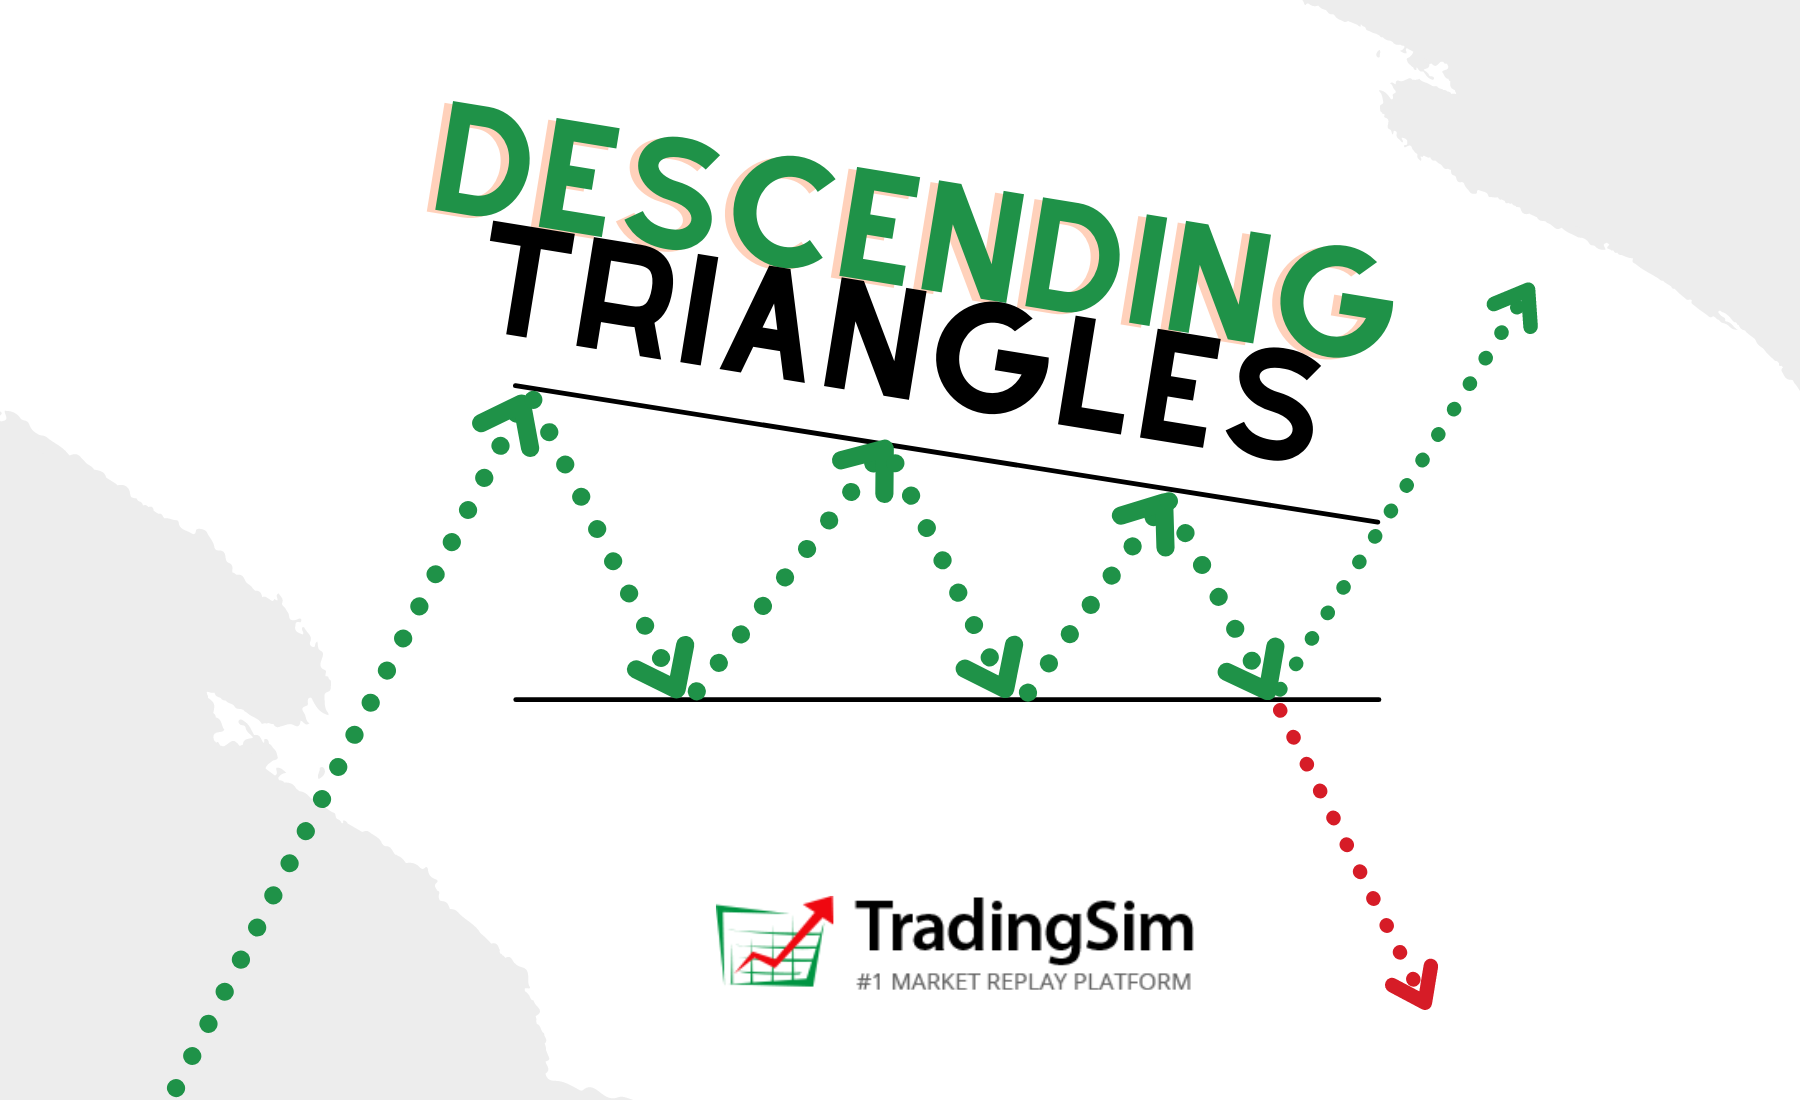
The classic version of this pattern forms with a trend line that is sloping and a flat or a horizontal support line. The pattern emerges as price bounces off the support level at least twice. The completion of the pattern occurs after the end of a retracement in a downtrend.

The downside breakout from the support triggers a strong bearish momentum-led decline.

However, this textbook pattern seldom occurs in the real markets. In most cases, a descending triangle pattern can also see a sloping base as well. Instead of a flat support level, you can see higher lows being formed.

The illustration below shows an “ideal” descending triangle pattern, which is often labeled a descending wedge, as well.

Example illustration of a classic descending triangle pattern

Typically, the breakout from a descending triangle is triggered to the downside. The distance from the support to the first high is measured. This measured distance is then projected to the downside where the target price can be set.

However, not all descending triangles breakout to the downside. You can also see an upside breakout from the descending triangle. In this case, it becomes a continuation pattern instead of a reversal pattern.

The same concept of measuring the distance from the support to the first high is used to determine targets. This is then projected to the upside for the minimum price objective.

In the next section of this article, we illustrate five descending triangle trading strategies that can be used.

1. The Descending Triangle Breakout Strategy

As the name suggests, the descending triangle pattern breakout strategy is very simple. It involves an anticipation of a breakout from the descending triangle pattern. This strategy uses a very simple combination of trading volumes and asserting the trend, which can be used to capture short term profits.

The first step in trading this strategy is to pick a stock that has been in a downtrend or in a consolidation phase. The time frame of the chart is irrelevant as you can use this strategy across any time period. Once you have identified a stock and the time frame, wait for price action to contract.

Be sure to allow for some flexibility in charting the patterns. Simply watch for lower highs and lower lows being formed. Once you have identified this price action, the next step is to draw or chart the descending triangle pattern.

The basic premise of using this strategy is to look at volume once you’ve identified the pattern. You can typically observe that volume begins to diminish toward the end of the descending triangle pattern formation.

The chart below shows an example of the Microsoft (MSFT) daily stock chart. In the chart, you can see that the triangle pattern was formed after price action was trading sideways. After a brief consolidation, price falls lower before breaking out from the pattern.

Descending Triangle MSFT
Descending triangle pattern breakout strategy

Volumes are usually lower closer to the breakout. Once you identify the lower volume, simply measure the distance from the first high and low. Then you project the same from the breakout area which becomes your target price. We show this with the dotted lines on the chart above.

This simple volume based descending triangle pattern is easy to trade but requires lot of time to watch the charts.

2. Descending Triangles with Heikin Ashi Charts

Using Heikin Ashi charts along with the descending triangle pattern you can develop a powerful but simple trading strategy. Heikin Ashi charts visually stand out compared to the conventional chart types.

One of the main characteristics unique to Heikin Ashi charts is the fact that they can depict the trend easily. Most traders often struggle when it comes to identifying the trend. You can resolve this confusion by switching to Heikin Ashi charts.

In this strategy, traders simply need to wait for the descending triangle pattern to be formed. Once the pattern has been identified, the next step is to wait for the bullish trend to pick up. In most cases, you will find that the Heikin Ashi candlesticks turn bullish prior to the breakout. This can be used as an initial signal to prepare for long positions in anticipation of a breakout.

The next chart below shows the Heikin Ashi chart for Alcoa (AA) on the 60-minute time frame. Notice that, prior to the breakout, the Heikin Ashi candlesticks turn bullish.

Descending triangle with Heikin Ashi candlesticks

Making Price Target Projections

The projections are based on the same strategy as before. Measure the distance from the first high to the first low and project the same from the anticipated breakout level.

Wait for the breakout from the descending triangle pattern. Initiate a long position after the first bullish Heikin Ashi candlestick. Then, project the measured distance from the breakout to get the target price.

Depending on your charting platform, you will notice that volume bars also change. This is because they reflect the bullish/bearish sentiment based on the Heikin Ashi candlesticks. Volume bars serve an additional purpose to alert you to a potential bullish breakout.

This descending triangle strategy with Heikin Ashi charts is effective to trade in the short term.

3. Descending Triangle with Moving Averages

Traders and intraday speculators can also combine price action techniques and chart patterns with technical indicators. Moving averages are one of the oldest and simplest of technical indicators to work with.

It is important to note that in this trading strategy we use the descending triangle pattern to anticipate potential breakouts. Along those lines, the moving average indicators serve the purpose of triggering the signal to initiate a trade.

In the following example, we use a 60-minute stock chart for General Motors (GM). We use a 10 and 20 period exponential moving average. Traders can experiment with their own settings on the period of the moving average; this depends on the time period that you use. For example, for a daily chart time frame, you can use the 10, 20 or 20 and 50 period settings.

Also note that using small periods (less than 10) could make your moving averages more sensitive to noise.

Descending triangle with moving averages

The above chart shows the 10 and 20 period EMA applied to the chart for GM. Notice that prior to the break out, the moving averages signal a crossover buy. The moving averages can be a great source to alert you when to initiate a trade.

There is no need to make use of volumes when trading with this strategy. Also note that you will not always see a bullish signal from the EMA’s prior to the breakout. After you get a bullish EMA signal and a breakout, it is an ideal signal to trade.

Projections and target price level methods remains the same as outlined in the initial strategy.

4. The Descending Triangle Reversal Topping Pattern

You can identify the descending triangle reversal pattern at the top end of a rally. This pattern emerges as volume declines and the stock fails to make fresh highs. The pattern indicates that the bullish momentum is exhausting. At the same time, price action forms a horizontal support level.

After price bounces off the support level multiple times, posting lower highs, we can anticipate a potential downside breakout. The minimum distance that price moves prior to the breakout is measured from the initial high. This distance is projected lower after price breaks out below the support level.

The descending triangle reversal pattern can be very easy to trade if you spot the pattern ahead of the breakout.

The next chart below illustrates the descending triangle reversal pattern in play. The stock chart for Morgan Stanley (MS) shows that after a strong rally, price stalls near the highs. Notice the support level that also stands out.

The Descending triangle reversal pattern at top

The resulting bounce off the support level leads to a lower high. Following this, price breaks down below the support with strong momentum. As you can see, the minimum measure distance is nothing but the project from the initial high.

5. Descending Triangle Reversal Pattern at Bottom

The descending triangle reversal pattern at the bottom end of a downtrend is the direct opposite of a distribution event. In this case, you will find that price action stalls at the end of a downtrend. A horizontal support level marks a bottom in price.

Multiple attempts to the upside lead to lower highs. Subsequently, price action eventually breaks to the upside from the descending triangle reversal pattern at bottom. Unlike the strategy mentioned previously, in this set up, you can trade long positions.

Traders can anticipate a potential upside breakout and trade the pattern accordingly.

Descending triangle reversal pattern at bottom

In the above chart set up for Goldman Sachs (GS), you can see how price fell to the lows, establishing support. The horizontal support level holds the declines where the bounce off the support level leads to lower highs.

Eventually, price action breaks out from the sloping trend line. Measure the distance from the horizontal support to the initial high and project this distance from the breakout level. The projected distance becomes your target price level.

Tips when Trading the Descending Triangle Pattern

Subjectivity is essential when trading the descending triangle pattern. Traders who wait for the “classic” descending triangle pattern will often find themselves on the sidelines.

Familiarity and experience are the best ways to trade, and that can only come through practice.

Keep in mind that the descending triangle pattern is also know as a measured move chart pattern. A measured move chart pattern is when you measure the distance and project the same from a breakout.

Many other trading strategies can blend well with the descending triangle chart pattern. It fits perfectly well within an investor’s buy and hold strategy. The triangle pattern also works with technical analysis which can complement the fundamental analysis as well.

In conclusion, the descending triangle pattern is a versatile chart pattern which often displays the distribution phase in a stock. Following a descending triangle pattern, the breakout is often swift and led with momentum. This can lead to strong results when one becomes familiar with the trading strategies outlined.

Indecision candle pattern slide

Ever wonder if a doji candle is bullish or bearish? How about a spinning top? Our goal in this tutorial is to uncover the fundamentals of indecision candlestick patterns, their significance, and a few strategies for how to trade them. By the end, you should be able to spot bullish and bearish dojis, spinning tops, and haramis!


The world of candlestick patterns is exciting. It’s like learning a new language, especially when you are new to the world of trading. At first, charts can appear daunting and mysterious. Like a bunch of noise. But with proper education, candlestick patterns can uncover a world of meaning and opportunity.

Before we move forward, if you haven’t studied the basics of candles and candlestick patterns, be sure to check out our introduction guide.


What Are Indecision Candles?

Indecision candlesticks are just that: a candle that represents indecision in the markets at a given point in time. The reflect either a pause in price action, or a temporary stalemate between bulls and bears.

But do not be confused. Just because they are called indecision candles, doesn’t mean we can’t interpret the candles.

Most indecision candles are referred to as dojis, spinning tops, or harami candles. They are all quite similar in that they visually represent a small bodied candle on a chart.

Depending on the context, these candles can be bullish or bearish. They can even be neutral in a sideways/non-trending environment.

What we have to pay attention to as traders is the reaction. In other words, what happens next?

But before we get into recognizing strategies and examples, let’s have a quick refresher on how indecision candlesticks are formed.

How Indecision Candles Are Formed

Bullish Doji Candle formation
Bullish indecision candles

Here we have an example of a bullish doji, or spinning top, depending on how you want to look at it. They are generally narrow bodied candles with wicks at both ends, both of which are very important.

Why do we call it a bullish doji candle is this instance? Mainly because it close green. But we’ll dig deeper into the “why”.

Why are the wicks important?

Generally speaking, wicks at the bottom of a candle indicate demand. Wicks at the top of a candle indicate selling pressure. Why else would the price have stopped at those levels and retracted?

Of course, this is an overgeneralization as there is buying and selling going on the entire time. But this does reveal something to the perceptive trader about the character of the candle.

In short, the key takeaway is that there is no decisive close at the highs, or the lows.

As a result, what is left is a narrow body candle where the price closes near the open of the candle.

Why is the narrow body important?

Bulls and bears were both very active, but neither could gain the upper hand. The outcome of all that effort is essentially ending up where they both began.

You might call it a standoff.

In order to help visualize this, you might imagine the direction of price action as the candle forms — the natural ebb and flow of buying and selling.

Inside the formation of a bullish doji indecision candlestick
Inside the formation of a bullish doji indecision candle

This can occur in either direction, up or down, as mentioned earlier. To form the body of the candle, we first get a sell off. After the sell off comes a nice bullish rally. However, as the bulls lose steam, bear regain some control into the close of the candle with selling pressure.

The candle closes green, so we call it a bullish doji.

Here’s another example in the opposite direction, just to stay well-rounded:

Inside the formation of a bearish doji indecision candle

This time the bulls start out in control and push the price of the stock higher. Unfortunately for them, there is a huge selloff as supply outweighs demand. But towards the close, there is a glimmer of hope for the bulls as they rally back.

Because this candle closes ready, however, we’d call it a bearish doji candle.

If you think of it in terms of “who is in control,” it can really help tell the story. If the open price is your typical average price paid, once the price dips below that level, the buyers at the highs are now under water.

What happens?

Bears take advantage of their vulnerability, slamming the price lower by shorting, as bulls sell, sell, sell.

On the contrary, once the price reaches an “oversold” level, bears start taking their profits and bull start coming back to buy at lower price. Thus we have a rally.

But overall, the big picture is that there was a lot of buying and selling going on. But no one has a clear upper hand by the time the candle is closed.

Now that we have covered the basics of what Indecision Candles are and how they are formed. Let’s look at some examples of the types of indecision candle patterns you might run into while trading.

4 Bullish and Bearish Indecision Candle Patterns

In these sections, we’ll look at two types of doji candles, the Dragonfly Doji and the Gravestone Doji. We’ll also examine the Spinning Top and Harami candles.

1. Gravestone Doji

Be sure to check out our other posts for an in depth look at how to trade using the Gravestone Doji reversal pattern, along with other candlestick pattern resources.

Gravestone Doji

Visually, it is long narrow wick, with a very narrow base at the bottom. There is virtually no body in the candle. Imagine the side profile of a gravestone. This is it’s namesake.

Similar to other dojis, the price of the opening of the candle is almost identical to the close. Only this time, the open was at the very low.

As the candle forms, it pushes higher, only to find exhaustion at the highs. Consequently the price collapses on itself and closes where it started.

Context

When you find a Gravestone Doji in an uptrend, what is it telling you? If price is being pushed higher in the trend only to reverse on itself, that is weakness, right? We can call this a bearish Gravestone doji candle.

Let’s look at an example with JMIA on a 1-minute chart:

JMIA bearish Gravestone Doji Example
JMIA intraday chart with Gravestone Doji Indecision Candlestick Pattern

Now, you’re probably thinking, “why do we call it an indecision candle if it is a possible reversal pattern?”

Again, it all boils down to context, context, context.

In this example, pay close attention to the trend. Then narrow your focus on the volume signature associated with the Gravestone Doji candles. Note how elevated the volume is there compared to the rest of the candles on the chart. That’s the context you need: effort versus result.

The effort comes in to push the stock price higher, but it reverses on heavy volume.

Where Should You Enter?

Because these are indecision candles, we need to wait for confirmation. Imagine if you had taken the first Gravestone Doji to the short side in the example above. You would have been stopped out.

Sometimes it is better to wait for a close below the bearish doji, a nice red candle, to confirm our thesis. In the example above, we don’t get that red close until the second Gravestone candle.

Now, what if you spot one of these in a down trend? Would you consider it strength or weakness? A bullish or bearish doji candle? Think about it for a moment. Price tries to rally, but it gets shoved back down.

Let’s look at an example:

JMIA intraday bearish Gravestone Doji candle explanation
JMIA intraday Gravestone Doji candle explanation

As you can see, it is all about the context, and all about the story behind the price and volume. Price tries to rally. However, it falls short after the Gravestone Doji dashes the hopes of the bulls. Thus, the downtrend continues.

For our entries, we wait for the close of the doji, and sell short on a close lower in the next candle or two. As always, set a stop at the high of the Gravestone Doji, or in the body of the wick.

2. Dragonfly Doji

The Dragonfly Doji is essentially a Hammer Candle, but with a narrower body. It can also be a bullish or bearish doji candle, but is considered the opposite pattern to the Gravestone Doji. For this reason, we’ll call it bullish.

Dragonfly Doji Candlestick pattern

As an indecision candlestick pattern, it has all the same qualities we have mentioned for the Gravestone Doji. Only this time, in reverse.

Selling pressure comes in, creates a long tail/wick, then buyers show up to raise the price of the stock.

Why is this indecision? It all has to do with context.

Context

Let’s suppose we are in a downtrend. Sellers appear to be in control. However, we are surprised when the price begins to reverse, culminating in a bullish Dragonfly Doji pattern.

Such is the example with BABA below. We call it indecision because we are at a crossroads. Bears were firmly in control. Now, we aren’t sure anymore.

The answer lies in what comes next.

BABA intraday bullish Dragonfly doji candle pattern example.
BABA Dragonfly Doji indecision candlestick pattern

Clearly, bulls took advantage of the situation, and ultimately took control by reversing the trend.

Where Should You Enter?

Like the Gravestone Doji, you want to wait for a nice close to confirm the reversal. In this instance, we might weight for the next candle, or the second thereafter to break higher.

Stops can be set in the body of the Dragonfly Doji or lower depending on risk tolerance.

Dragonfly Dojis can show up in mid trend as well, offering opportunities to add to positions.

On the same intraday chart (BABA) from above, we see the healthy trend that followed our initial reversal. Take a moment and study this next chart to see how the handful of dojis we’ve pointed out lead BABA to higher prices.

BABA Dragonfly Doji Candlestick Pattern example
BABA series of Dragonfly Doji candlestick patterns

Effectively, they are areas of indecision that resolved higher.


3. Spinning Top

According to IG.com, the Spinning Top is known most often as a continuation pattern. The concept being similar to other indecision candles in a trending environment.

However, there are times, according to context, that the Spinning Top can signal a reversal of trend.

Spinning top bullish and bearish indecision candlestick patterns
Bullish and bearish Spinning Top candlestick patterns

As with most candlestick patterns, there is a bullish and bearish version to the Spinning Top. For a detailed explanation, be sure to revisit our discussion and slides above.

In short, for a bullish Spinning Top, it has to open, move lower, rally, and then close green. Flip this sequence for the bearish Spinning Top.

Let’s stick with our analysis of BABA and see if we can uncover a few Spinning Tops in the trend.

Context

Firstly, we notice that a bullish Spinning Top forms immediately after the bullish Dragon Fly doji candle at the bottom of the down trend. What is this telling us?

Look closely at the body of the three doji candles in secession at the bottom of the chart in the example belowe. Note that their opening and closing prices are all extremely close together. You have an Inverted Hammer, followed by a Gravestone Doji, followed by a Spinning Top.

Talk about indecision! Would these be bullish or bearish dojis?

What we see is that the bulls and bears were fighting to win this price level, judging by the tightness of the candle bodies and their closing prices. Bulls were defending this level heavily, while bears were trying to push it down.

Thus, the indecision on whether not we would go lower.

Bullish Spinning Top indecision candles
BABA bullish Spinning Top indecision candles

Thankfully for the longs, after the Spinning Top, the price moves decisively and violently higher on heavy volume, signaling our long entry. Now, we can decisively say it was a bullish doji pattern.

Secondly, we see another Spinning Top in the middle of the uptrend. What do we make of this? After all, we have been trending upwards. Could this be a reversal? Or, just a pause in the trend?

Perhaps you have some profit taking, but the trend doesn’t seem very extended. Let’s call this a pause, and look for a real Spinning Top reversal.

WATT gives us such a reversal with a spinning top on the intraday 1-minute chart in this example:

WATT Spinning Top reversal bullish doji
Where Should You Enter?

Ideally, the entry is on the break lower as the second candle forms and surpasses the Spinning Top body and wick. Some may wait for the close of that candle to confirm, others are willing to enter early and risk above the Spinning Top.

4. Harami

The Harami is a unique candlestick pattern. It can be a reversal or a continuation, though usually thought of as a reversal.

The name comes from the Japanese word for “pregnant.” Evidently, the Japanese thought the pattern resembled a pregnant woman.[efn_note]Chen, J. (2020, January 17). Bearish Harami Definition. Investopedia. https://www.investopedia.com/terms/b/bearishharami.asp#:%7E:text=%E2%80%9CHarami%E2%80%9D%20is%20the%20Japanese%20word,use%20as%20a%20trading%20signal..[/efn_note]

Along those lines, the Harami candle is a narrow body candle that is an “inside” candle. Hence the allusion to a baby in the body of the larger candle.

Bullish and bearish Harami doji candlestick patterns

For a bearish Harami candle, the body of the Harami must be a bearish or red/black doji candle immediately following a longer bodied bullish candle.

In contrast, the bullish Harami doji must be bullish/green and close inside a large bodied bearish candle.

Context

By now, you should understand what context will likely matter for the Harami, or any doji candlestick pattern. What do we look for?

  • Trend: up, down, sideways?
  • Volume signature
  • Extended? Oversold or overbought conditions?
  • Time frame?

These are just a handful of important criteria you will always want to consider when analyzing the efficacy of the pattern.

For example, if it is a bullish Harami pattern, is the stock in an oversold downtrend with a high volume spike signaling a reversal?

Or, is the stock in the middle of a young uptrend and only consolidating?

For the first example, lets look at FSR. After a steady decline followed by a massive flush on heavy volume, price pauses. It pauses inside the bearish red candle signaling indecision.

Price pauses then reverses with this FSR bullish Harami doji candle pattern

You expect price to continue lower after such a bearish red candle. Yet, to the surprise of the bears, the downward momentum is stopped and reversed.

It would be safe, then, to assume that the supply in that red candle was either absorbed, and/or no more sellers were present thereafter, sending the stock price higher.

On the flip side, you can find the exact same pattern as a bearish reversal at the top of an uptrend.


To switch gears on this pattern, let’s examine a continuation pattern with a bearish Harami pattern. The peculiar nature of this example is that it isn’t actually “bearish” for the overall trend. The name simply implies that there is a bearish/red Harami doji candle inside a bullish candle.

Bearish Harami in an otherwise continuing uptrend

You might be thinking, “Great, how confusing!”

But before you toss up your hands, remember that it is all about context, as we have been belaboring in each of these examples. Reversals are different from continuation patterns, and you’ll need to understand both in trading.

Here is the mirror image for a down-trending context:

TSLA bearish Harami candle continuation pattern
When Should You Enter?

For the Harami, you obviously want to pick the direction of the prevailing trend, or the new direction of the reversal. To do this, you need to wait for the confirmation.

In other words, is the Harami candle broken to the downside, or the upside, and what is the context. For a reversal long, take the next candle that breaks the upside of the Harami and set your stop below the Harami.

For a continuation downward, just reverse that process.

More Strategies For Trading Indecision Candles

These can be great patterns to play with the ABCD strategy. Be sure to check out our webinar on this explosive pattern!

For more on Haramis, our in-house trading expert Al Hill covers a handful of strategies in this fantastic tutorial.

How To Practice Indecision Candle Pattern Recognition

As with any trading strategy, experience is paramount. Do you have time to sit in front of the markets every day? If so, how many of these patterns will you be able to find? How long will it take you to master the patterns?

To that end, simulated training can supercharge your pattern recognition skills. Deliberate practice on your own time, coupled with analysis of your trades, are the most efficient method for learning volume and price analysis.

With enough practice, you might just find yourself an expert at discerning bullish and bearish doji candles like Gravestones, Dragonflies, Spinning Tops, and Haramis.