4 Simple Scalping Trading Strategies and Advanced Techniques

Scalping 101 banner

Today we are going to cover one of the most widely known, but misunderstood strategies – scalp trading, a.k.a scalping. If you like entering and closing trades in a short period of time, then these strategies will definitely suit you best.

We’ll touch on the basics of how to scalp trade, then dive into specific trading examples. At the end, we’ll cover more advanced scalp trading strategies and techniques that will help increase your odds of success.

Scalp Trading Definition

Scalp trading can be one of the most challenging styles of trading to master. It requires unbelievable discipline and trading focus. Despite the trend in high frequency trading these day, scalping has been around for a while.

Traders are usually attracted to scalp trading for the following reasons:

  • less potential exposure to longer-term risk
  • higher frequency trading — you can place up to a hundred trades or more per day
  • ability to fight the greed, since your day trading profit targets are very small
  • a greater number of trading opportunities

The Decimal System

Years ago, when stocks were quoted in fractions, there was a standard spread of 1/16 of a dollar or a “teenie”. This spread allowed scalp traders to buy a stock at the bid and immediately sell at the ask. Hence the teenie presented clear entry and exit levels for scalp traders.

Bucket Shops
1892 Trading Bucket Shops

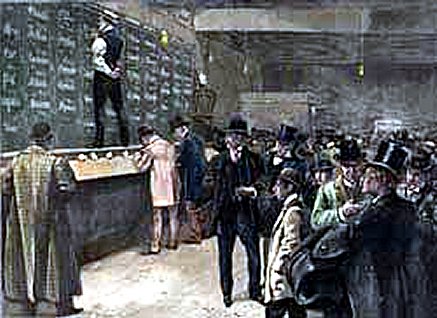
The scalp trading game took a turn for the worse when the market converted to the decimal system. The decimal system closed the “teenie” often times to within 1 penny for high volume stocks. Overnight, this shifted the strategy for scalp traders.

A scalp trader now had to rely more on instincts, level II quotes, and the time and sales window.

How to Scalp Trade

A scalp trader can look to make money in a variety of ways.

One method is to have a set profit target amount per trade. This profit target should be relative to the price of the security and can range between .1% – .25%.

Another method is to track stocks breaking out to new intra-day highs or lows and utilizing Level II to capture as much profit as possible. This method requires an enormous amount of concentration and flawless order execution.

Level II montage gif
A Level II montage. Source: CenterPoint Securities

Lastly, some scalp traders will follow the news and trade upcoming or current events that can cause increased volatility in a stock.

Winning is Critical

Unlike a number of day trading strategies where you can have a win/loss ratio of less than 50% and still make money, scalp traders must have a high win/loss ratio. This is due to the fact that losing and winning trades are generally equal in size. The necessity of being right is the primary factor scalp trading is such a challenging method of making money in the market.

Now that we have covered the basics of scalping, let’s explore a few scalping strategies you can test for yourself.

Scalp Trading Strategies

Strategy #1 – Pullbacks to the Moving averages

We discuss this in detail in a post on 20 Moving Average Pullbacks. It can be a very lucrative strategy on any time frame.

In a nutshell, it is a scalping strategy that is focused on joining a trend in either direction by jumping into a stock as it pulls back to a popular moving average.

This method has been popularized by legendary traders like Linda Raschke.

The criteria you want to look for in this strategy are as follows:

  1. Strong momentum in either direction
  2. A clear trend
  3. Pause in the trend with constructive/light pullback volume
  4. The ability to enter at the 20 moving average
  5. Reclaim of the prior trend

Here is an example of what this might look like with ticker symbol SGOC.

20 moving average pullback

As you can see, the stock is minding the 20 moving average the entire time, until the top around 11:15. Profits can be taken along the way as you add and sell around a core position.

#2 – Scalp Trading with the Stochastic Oscillator

One of the most attractive ways to scalp the market is by using an oscillator as the indicator leads the price action.

Yes, it sounds pretty simple; however, it is probably one of the hardest trading methodologies to nail down.

Since oscillators are leading indicators, they provide many false signals. The reality is that if you scalp stocks with one oscillator, most likely you are going to accurately predict the price action 50% of the time.

This is literally the equivalent to flipping a coin.

While 50% may prove a profitable ratio for other strategies, when scalping, you need a high win to loss ratio due to the increased commission costs.

Let’s dig a little deeper.

Stochastics

The slow stochastic consists of a lower and an upper level. The lower level is the oversold area and the upper level is the overbought area.

When the two lines of the indicator cross upwards from the lower area, a long signal is triggered. When the two lines of the indicator cross downwards from the upper area, a short signal is generated.

The below image further illustrates these trade signals.

PYPL with Stochastics scalp trades
Stochastic Scalp Trade Strategy

This is the 5-minute chart of Paypal. At the bottom of the chart, we see the stochastic oscillator. The circles on the indicator represent the trade signals.

In this case, we have 4 profitable signals and 6 false signals. The 4 profitable signals generate $16.00 per share of Paypal. However, the losses from the 6 false signals generate a loss of almost $10.00 per share.

You are probably asking yourself, what went wrong?

The bottom line is the stochastic oscillator is not meant to be a standalone indicator.  You need some other form of validation to strengthen the signal before taking a trading opportunity.

#3 – Scalp Trading with Stochastics and Bollinger Bands

In the next trading example, we will combine the stochastic oscillator with Bollinger bands.

We will enter the market only when the stochastic generates a proper overbought or oversold signal that is confirmed by the Bollinger bands.

In order to receive a confirmation from the Bollinger band indicator, we need the price to cross the red moving average in the middle of the indicator. We will stay with each trade until the price touches the opposite Bollinger band level.

Stochastic and Bollinger Band Scalp Strategy

Above is the same 5-minute chart of PYPL. This time, we have included the Bollinger bands on the chart.

Trade Signals

We start with the first signal which is a short trade. Notice that the stochastic generates a bearish signal. Also, the price does break the 20-period moving average on the Bollinger band. Therefore, the signal is good.

The second signal is bullish on the stochastic and we flip long until the price touches the upper Bollinger band.

At the end of this bullish move, we receive a short signal from the stochastics after the price meets the upper level of the Bollinger bands for our third signal. A price decrease occurs, but the moving average of the Bollinger bands isn’t broken to the downside.

We get a series of fake outs, and then the stochastics finally cross a fifth time, this time with confirmation on the bollinger band as well. You may be thinking, but what about that one cross of the median during the chopfest.

You may have take a small loss here depending on whether you took this trade or not. The second signal provided a re-entry in that case.

The third trade provides a short opportunity after the stall at the highs. We have a short signal confirmation and we open a trade.

This lasts until the double bottom reversal long signal.

The stochastic generates a bullish signal and the moving is broken to the upside, therefore we enter a long trade. We hold the trade until the price touches the upper Bollinger band level.

False Signals

As you can see on the chart, there are quite a few false signals in a row.  Talk about a money pit!

The good thing for us is that the price never breaks the middle moving average of the Bollinger band, so we ignore all of the false signals from the stochastic oscillator, except for maybe one.

If we compare the two trading methodologies, we realize that with the Bollinger bands we significantly neutralized all the false signals.

Profits

With a $10,000 bankroll with day trading leverage of 1:4, we have a buying power of $40,000. If we then invest 15% of our buying power in each trade ($6,000), below are the results:

First trade: 23 shares x $3 = $70 profit.

Total bankroll: $10,000 + $70 = $10,070.00

Second trade: 23 shares x $2 = $50 profit

Total bankroll: $10,070 + $50 = $10,120.00

Third trade (Stop Out): 23 x -$0.50 = -$11.50 profit

Total bankroll: $10,074.52 – $11.50 = $10,108.50

Fourth trade: 23 shares x $5 = $115 profit

Total bankroll: $10,108.50 + $115 = $10,223.00

Fifth trade: 23 shares x $1 = $23 profit

Total bankroll: $10,223.00 + $23 = $10,246.00

We were able to generate $246.00 of profit with four scalp trades and one stop loss. Each of these trades took between 20 and 25 minutes.

While these trades had larger percentage gains due to the increased volatility in Paypal, the average scalp trade on a 5-minute chart will likely generate a profit between 0.2% to 0.3%.

As you can see, the stochastic oscillator and Bollinger bands complement each other nicely. The stochastic oscillator says “get ready!” and the Bollinger bands say “pull the trigger!”

#4 – Scalp at Support and Resistance

This a very popular strategy that comes from the teachings of Richard D. Wyckoff and his trading range theories. Simply put, you fade the highs and buy the lows.

You really need the following two items (1) low volatility and (2) a trading range.

The low volatility reduces the risk of things going against you sharply when you are first learning to scalp. The trading range provides you a simple method for where to place your entries, stops, and exits.

In the next example, let’s take a look at the S&P Futures E-mini contract to identify scalping opportunities.

Why the E-mini contract? Well, it has low volatility, so you have a lower risk of blowing up your account if you use less leverage and the E-mini presents a number of trading range opportunities throughout the day.

S&P Mini Futures Scalp Trades
E-mini Scalp Trades

Notice how the tight trading range provides numerous scalp trades over a one-day trading period. Later on in this article, we will touch on scalping with Bitcoin, which presents the other side of the coin with high volatility.

To learn more about stops and scalping trading futures contracts, check out this thread from the futures.io community.

Advanced Scalping Techniques

Risk Management when Scalp Trading

We discussed a profitable scalp trading strategy with a relatively high win/loss ratio. We also suggested leveraging 15% of the buying power for each scalp trade. Now we need to explore the management of risk on each trade to your trading portfolio.

Since you are a scalp trader, you aim for lower returns per trade, while shooting for a higher win/loss ratio.

Therefore, your risk per trade should be small, hence your stop loss order should be close to your entry.

To this point, try not to risk more than .1% of your buying power on a trade.

Let’s see how a tight stop would impact the stochastic/Bollinger bands scalp trading strategy.

Example: ORCL

Stop Loss Orders - Scalp Trading
Stop Loss Orders – Scalp Trading

For this example, we had a total of 3 trades.

For the first trade, the stochastic crossed below the overbought area, while at the same time the price crossed below the middle moving average of the Bollinger band.

We shorted Oracle at $39.06 per share, with a stop loss at $39.09, 0.1% above our entry price. The price began decreasing and 14 minutes later, ORCL hit the lower Bollinger band. We exited the trade at 38.95, with a profit of 0.28%.

After hitting the lower Bollinger band, the price started increasing. The stochastic lines crossed upwards out of the oversold area and the price crossed above the middle moving average of the Bollinger band.

We went long on this signal at $39.04. Our stop loss is located at $39.00, 0.1% below the entry price. This trade proved to be a false signal and our stop loss of .1% was triggered 2 minutes after entering the trade.

The third and final signal took over 40 minutes to develop.

After the price crossed above the oversold territory and the price closed above the middle moving average, we opened a long position.

We entered the market at $38.97 per share with a stop loss at $38.93, 0.1% below our entry price.

This time Oracle increased and we closed a profitable trade 2 minutes after entering the market when the price hit the upper Bollinger band, representing a 0.17% price increase.

Profitability

So, if we had a $10,000 bankroll leveraged to $40,000 buying power, these are the results from a 15% investment per trade:

First Trade: 6,000 x .28% = $16.80 profit.

Total bankroll: 10,000 + 16.80 = $10,016.80

Second Trade: 6,010.08 x -0.1% = $6.01 loss

Total bankroll: 10,016.80 – 6.01 = $10,010.79

Third Trade: 6,006.47 x 0.17% = $10.21 profit

Total bankroll: 10,010.79 + 10.21 = $10,021

These three trades generated a profit equal to $21. The total time spent in each trade was 18 minutes.

Scalp Trading and Commissions

Usually, when you scalp trade you will be involved in many trades during a trading session. Sometimes, scalp traders will trade more than 100 trades per session.

If you look at our above trading results, what is the one thing that could completely expose our theory?

You guessed it right, commissions.

If you have a flat rate of even 5 dollars per trade, this would make the exercise of scalp trading pretty much worthless in our previous examples.

This is why when scalp trading, you need to have a considerable bankroll to account for the cost of doing business.  You are going to find it extremely difficult to grow a small account scalp trading after factoring in commissions and the tax man at the end of the year.

The only thing you will end up doing after thousands of trades is lining your broker’s pocket.

Unlimited Monthly Trading

Just having the ability to place online trades in the late 90s was thought of as a game changer. Now fast forward to 2021 and there are firms popping up offering unlimited trades for free.

So, if you are looking to scalp trade, you will want to give some serious thought to signing up for one of these brokerage firms. Let’s say you place on average 10 trades per day. This would translate to approximately 2,400 day trades per year.

Assuming the average commission per trade is $4, this could run you over $12,000 per year.

Most brokerage firms do this, so you shouldn’t have a hard time finding one.

Focus on Profit to Risk Ratios and Limiting Your Number of Trades

This is going to sound counter to the entire idea of scalp trading.

What comes to mind when you hear scalp trader? You are likely going to think of a trader making 10, 20 or 30 trades per day.

Well, what if scalp trading just speaks to the amount of profits and risk you will allow yourself to be exposed to and not so much the number of trades.

Here is another story that references a study from FXCM [ 1] which showed profitability often came down to trading less. Also, if traders use proper risk-reward expectations – they will make more money over the long run.

So again, as a scalper or a person looking into scalp trading – you might want to think about cutting down on the number of trades and seeking trade opportunities with a greater than 1 to 1 reward to risk ratio.

Competing with the Algos

We can’t get through an article on scalp trading strategy and not touch on the topic of algorithmic trading. 20 years ago, you were trading against other humans.

Now there are open source algo trading programs anyone can grab off the internet. These algorithms are running millions of what-if scenarios in a matter of seconds.

It’s gotten to the point now that large hedge funds have entire quant divisions setup to find these inefficiencies in the market.

This may or may not matter to you and your style of trading. The only point we are trying to make is you need to be aware of how competitive the landscape is out there.

Now we all have to compete with the bots, but the larger the time frame, the less likely you are to be caught up in battling for pennies with machines thousands of times faster than any order you could ever execute.

In the book, Start Day Trading Now: A Quick and Easy Introduction to Making Money While Managing Your Risk, author Michael Sincere, touched on the topics of bots in trading.

Sincere interviewed professional day trader John Kurisko. In the interview Sincere states that Kurisko believes some of the reversals can be blamed on traders using high-speed computers with black-box algorithms scalping for pennies.

That’s one of the reasons many traders get frustrated with the market. The timing is not like it used to be, and many of the old rules don’t work like before,” he says. [2]

Taking Money Out of the Market

This is one positive regarding scalp trading that is often overlooked. In trading, you have to take profits in order to make a living.

This is much harder than it may seem as you are going to need to fight a number of human emotions to accomplish this task.

Well, this is where scalp trading can play a critical role in building the muscle memory of taking profits. Scalp trading requires you to get in and out quickly.

The keyword in that last sentence is out. The better you get at taking profits, the more consistent you’ll become.

Scalp Trading with Bitcoin

Scalp trading did not take long to enter into the world of Bitcoin. Traders in this growing market are forever looking for methods of turning a profit.

To this point, let’s review a few characteristics of Bitcoin that may prove challenging for scalp traders.

  • Bitcoin is really volatile with wild price swings [3]. Therefore, scalp trading will provide a number of trading opportunities, but you will need to adhere to strict stops to avoid getting in a jam.
  • There are many brokerage firms offering 15 to 1 leverage. Some even offer up to 50 to 1 leverage. While this may sound super exciting, in reality, this could expose you to the risk of blowing up your account.

So, as stated throughout this article, you will need to keep your stops tight in order to avoid giving back gains on your scalp trades.

Conclusion

Let’s review a few key points on scalping.

  • Scalp trading involves entering trades for a short period of time to catch swift price moves.
  • If you scalp trade, you need a win/loss ratio greater than 50%.
  • Oscillators could be very useful for your scalp trading system because they are leading indicators; however, oscillators are not meant to be a standalone indicator.
  • Try to find indicators that complement each other so you can validate trade signals.
  • Scalp trading money management is crucial:
    • – Invest around 15% of your buying power in each scalp trade.
    • Put a stop loss of 0.1% from your entry price.
    • Stay in the trades until the price hits the opposite Bollinger band
    • You will usually make between .2% and .3% per trade if you trade lower chart frames.
  • If you scalp on higher chart time frames (5-minute, or more) you targets might be higher.
  • You must have a solid bankroll to scalp trade. Small accounts will be eaten alive by trading commissions.

To practice scalp trading strategies and topics detailed in this article please visit the homepage https://tradingsim.com to see how we can help.

You can also simulate trading commissions to see how different tiers of pricing will impact your overall profitability.

Good luck!

External References

  1. Autochartist. 43 Million Trades Reveal the Secret of Profitable Traders [Blog Post].Autochartist.com
  2. Sincere, Michael. (2011). ‘Start Day Trading Now: A Quick and Easy Introduction to Making Money While Managing Your Risk‘. Simon & Schuster. p. 171
  3. Cheng CFP, Marguerita. (2018). Why Trading in Bitcoin or Other Cryptocurrencies is Playing with Fire [Article]. Kiplinger.com
RSI image

The relative strength index (RSI) is one of the most popular oscillators in all of trading. You have likely read some general articles on the RSI in your trading career, or have at least heard about it. However, in this post, we’ll present four unique, profitable RSI trading strategies you can use when trading.

Before we dive into the RSI trading strategies, let’s first ground ourselves on the basics of the RSI indicator. Then, we’ll provide you with a few relatively unknown techniques.

Relative Strength Index Definition

The Relative Strength Index (RSI) is a basic measure of how well a stock is performing against itself by comparing the strength of the up days versus the down days.  This number is computed and has a range between 0 and 100. 

A reading above 70 is considered bullish, while a reading below 30 is an indication of bearishness. Generally speaking, it helps to measure periods of overbought or oversold conditions.

Why the RSI?

As traders, our job is to look for an edge in the market. Indicators can certainly help with this if used correctly.

The RSI is no different. When used properly, it can help predict rising momentum, underlying demand or supply, and shifts in sentiment.

Using the indicator can also help predict trends, trend reversals, trend continuations, or stagnate corrections.

With practice, and in combination with a firm understanding of volume and price action, the RSI indicator can simply be a helpful tool in your trading arsenal.

Relative Strength Index Formula

The RSI was developed by J.Welles Wilder and detailed in his book New Concepts in Technical Trading Systems in June of 1978.

The default setting for the RSI is 14 days. You would calculate the relative strength index formula as follows:

Relative Strength =

1.25 (Avg. Gain over last 13 bars) +. 25 (Current Gain) / (.75 (Avg. Loss over last 13 bars) + 0 (Current Loss))

Relative Strength = 1.50 / .75 = 2

RSI = 100 – [100/(1+2)] = 66.67[1]

We certainly don’t recommend doing these calculations while you’re trading. After all, most charting platforms have an RSI indicator that does all the math for you.

The result is a plot on subchart that indicates the oversold and overbought conditions, like the one below this chart in this example:

NVDA RSI chart
NVDA RSI chart

How NOT To Use the Formula

Most traders use the relative strength index simply by buying a stock when the indicator hits 30 and selling when it hits 70. You can see these levels on the RSI indicator above.

However, if you remember anything from this article, remember that if you buy and sell based on this relative strength index trading strategy alone, “YOU WILL LOSE MONEY”.

The market does not reward anyone for trading the obvious. Now that doesn’t mean that simple methods don’t work. But simple methods that everyone else is following typically have low odds.

With that in mind, let’s discuss how to properly use this dynamic formula.

Finding RSI Indicator Settings

For every platform, the settings may be different. However, most platforms should have an RSI indicator.

Once you find the RSI indicator in your platform’s indicator index, you can edit the settings according to whichever relative strength index trading strategy you want to employ.

RSI Indicator Settings

In the screenshot above, you can see inside the TradingSim RSI settings. The default parameters are usually set for a 14 period and 80/20 upper and lower threshold.

Within, you can change the period from the standard 14 to whatever you prefer. You can also change the “overbought” and “oversold” parameters as you wish.

To that point, we’ll discuss different RSI trading strategies that may require you to modify these settings.

How to Use RSI Trade Signals

The RSI provides several signals to traders. In this next section we’ll explore the various trade setups using the indicator.

Defining the Current Trend

The RSI is much more than a buy and sell signal indicator. The RSI can provide you with the ability to gauge the primary direction of the trend.

So how do we do this?

First, we define the range where the RSI can track bull and bear markets.

Uptrends

For bull markets, you want to be on the lookout for signals of 66.66 and bear markets at 33.33 [2].

You’re probably noticing that this is slightly less than the normal 80/20 or 70/30 readings. These readings of 33.33 and 66.66 were presented by John Hayden in his book titled ‘RSI: The Complete Guide’.

John theorizes throughout the book that these levels are the true numbers that measure bull and bear trends and not the standard extreme readings.

rsi defining trend
RSI Defining Trend

Again, the RSI is not just about buy and sell signals. The indicator is about showing “strength,” particularly as a measure of the strength of the trend.

In the above chart example, the RSI shifted from a weak position to over 66.66. From this point, the RSI stayed above the 33.33 level for days and would have kept you long in the market for the entire run.

Downtrends

As you can see below, the RSI can also define downtrends. You just want to make sure the security does not cross 66.66.

Defining Downtrend
Defining Downtrend

Now, should you make buy or sell signals based on crosses of 33.33 and 66.66? Not too fast, there is more to the RSI indicator which we will now dive into.

RSI Support and Resistance

Did you know the RSI can display the actual support and resistance levels in the market? These support and resistance lines can come in the form of horizontal zones, or as we will illustrate shortly, sloping trendlines.

Breakouts

In the example below, the RSI predicts a breakout.

RSI Breakout
RSI Breakout

You may not know this, but you can apply trend lines to indicators in the same manner as price charts. In the above chart, Stamps.com was able to jump significant resistance on the RSI indicator and the price chart.

This breakout resulted in a nice run of over 7%.

Breakdowns

Let’s take a look at another example. This time, the RSI was able to call a top.

In this example, the RSI had a breakdown and backtest of the trendline before the fall in price. While the stock continued to make higher highs, the RSI was starting to slump.

RSI Trend Breakdown
RSI Trend Breakdown

The challenging part of this method is identifying when a trendline break in the indicator will lead to a major shift in price. As expected, you may have several false signals before the big move.

There is no such thing as easy money in the market. It only becomes easy after you have become a master of your craft.

RSI Divergence with Price

This is an oldie but goodie, and is still applicable to the RSI indicator. Building upon the example from the last section, you want to identify times where price is making new highs, but the Relative Strength Indicator is unable to make new highs.

RSI Divergence
RSI Divergence

This is a clear example where the indicator is starting to roll as the price inches higher.

RSI Double Bottom Signal

The Relative Strength Index can also be used for typical patterns like double bottoms.

For the example below, the first price bottom is made on heavy volume. This occurs after the security has been in a strong uptrend for some period.

Note that the RSI has been above 30 for a considerable amount of time. Nonetheless, after the first price sell-off, which also results in a breach of 30 on the RSI, the stock also has a snapback rally.

Double Bottom
Double Bottom

This rally is short lived and is then followed by another pullback, which breaks the low of the first bottom.

This second low is where stops are raided from the first reaction low. Shortly after breaking the low by a few ticks, the security begins to rally sharply.

Consequently, the second low not only forms a double bottom on the price chart but the relative strength index as well.

The reason this second rally has strength is (1) the weak longs were stopped out of their position on the second reaction, and (2) the new shorts are being squeezed out of their position.

The combination of these two forces produces sharp rallies in a very short time frame.

Exercise Caution

The tricky part about finding these double bottoms is timing. After the formation completes, the security may be much higher.

You are going to need tight stops to avoid ending up on the wrong side of the trade.

As mentioned earlier, it is easy to see these setups and assume they will all work. What people do not tell you is that for every one of these charts that play out nicely, there are countless others that fail.

It only takes one trader with enough capital and conviction to make mincemeat out of your nice charts and trendlines.

To that point, be sure to test your RSI trading strategies in a simulator first. This way you have an understanding of your probability for success.

RSI and the Broad Market

If you want to assess the broader market, there is an interesting approach of applying the RSI to the McClellan Oscillator.

Essentially, the McClellan measures the advancing and declining issues across the NYSE.

RSI Broad Market
RSI Broad Market

This won’t help you much day trading, as this sort of weakness in the broad market only occurs a few times a year.

However, if you are in the middle of a day trade, it might prepare you for the tidal wave that’s coming.

It’s amazing how applying a strength measurement to a broad market indicator can reveal when weakness hits a tipping point.

If you find this interesting, here is a post that analyzed the return of the broad market since 1950 after the RSI hit extreme readings of 30 and 70.

In the post [3], senior quantitative analyst Rocky White makes the case that over the short-term after a reading below 30, the bears are still in control. However, if you look a little further to the intermediate-term, the bulls will surface and a long move is in play.

Trading Strategies Using the Relative Strength Index Indicator

Although the RSI is an effective tool, it is always better to combine it with other technical indicators to validate trading decisions. The relative strength index trading strategies we will cover in the next section will show you how to reduce the number of false signals so prevalent in the market.

#1 – RSI + MACD

In this trading strategy, we will combine the RSI indicator with the very popular MACD.

In short, we enter the market whenever we receive an overbought or oversold signal from the RSI supported by the MACD. We close our position if either indicator provides an exit signal.

Example

This is the 10-minute chart of IBM. In this relative strength index example, the green circles show the moments where we receive entry signals from both indicators. The red circles denote our exit points.

Relative Strength Index + MACD

Slightly more than an hour after the morning open, we notice the relative strength index leaving an oversold condition, which is a clear buy signal. The next period, we see the MACD perform a bullish crossover – our second signal.

Since we have two matching signals from the indicators, we go long with IBM. We appear to be at the beginning of a steady bullish trend.

Five hours later, we see the RSI entering oversold territory just for a moment. Since our strategy only needs one sell signal, we close the trade based on the RSI oversold reading.

This position generated $2.08 profit per share for approximately 6 hours of work.

#2 – RSI + MA Cross

In this trading strategy, we will match the RSI with the moving average cross indicator. For the moving averages, we will use the 4-period and 13-period MAs.

We will buy or sell the stock when we match an RSI overbought or oversold signal with a supportive crossover of the moving averages. On that token, we will hold the position until we get the opposite signal from one of the two indicators or divergence on the chart.

First, let’s clarify something about the MA cross exit signals.

A regular crossover from the moving average is not enough to exit a trade. We recommend waiting for a candle to close beyond both lines of the moving average cross before exiting the market.

Example

To illustrate this RSI trading strategy, please have a look at the chart below:

Moving average cross
Moving Average Cross Divergence

This is the 15-minute chart of McDonald’s.

The RSI enters the oversold area with the bearish gap the morning of Aug 12. Two hours later, the RSI line exits the oversold territory generating a buy signal.

An hour and a half later, the MA has a bullish cross, giving us a second long signal. Therefore, we buy McDonald’s as a result of two matching signals between the RSI and the MA Cross. McDonald’s then enters a strong bullish trend, and 4 hours later, the RSI enters the overbought zone.

At the end of the trading day, we spot a bearish divergence between the RSI and McDonald’s price. Furthermore, this happens in the overbought area of the RSI. This is a very strong exit signal, and we immediately close our long trade.

This is a clear example of how we can attain an extra signal from the RSI by using divergence as an exit signal. This long position with MCD made us a profit of $2.05 per share.

#3 – RSI + RVI

For this RSI trading strategy, we’ll combine the relative strength index with the relative vigor index.

In this setup, you will enter the market only when you have matching signals from both indicators. Hold the position until you get an opposite signal from one of the tools – pretty straightforward.

Example

This is the 15-minute chart of Facebook. In this example, we take two positions in Facebook.

Relative Strength Index - RVI
Relative Strength Index – RVI

First, we get an overbought signal from the RSI. Then the RSI line breaks to the downside, giving us the first short signal.

Two periods later, the RVI lines have a bearish cross. This is the second bearish signal we need and we short Facebook, at which point the stock begins to drop.

After a slight counter move, the RVI lines have a bullish cross, which is highlighted in the second red circle and we close our short position. This trade generated a profit of 77 cents per share for a little over 2 hours of work.

Facebook then starts a new bearish move slightly after 2 pm on the 21st. Unfortunately, the two indicators are not saying the same thing, so we stay out of the market.

Later the RSI enters the oversold territory. A few periods later, the RSI generates a bullish signal.

Relative Strength Index - RVI
Relative Strength Index – RVI

After two periods, the RVI lines also have a bullish cross, which is our second signal and we take a long position in Facebook. Just an hour later, the price starts to trend upwards.

Notice that during the price increase, the RVI lines attempt a bearish crossover, which is represented with the two blue dots.

Fortunately, these attempts are unsuccessful, and we stay with our long trade. Later the RVI finally has a bearish cross, and we close our trade. This long position with FB accumulated $2.01 per share for 4 hours.

In total, the RSI + RVI strategy on Facebook generated $2.78 per share.

#4 – RSI + Price Action Trading

For this strategy, we’ll use the relative strength index overbought and oversold signal in combination with any price action indication, such as candlesticks, chart patterns, trend lines, channels, etc.

To enter a trade, you will need an RSI signal plus a price action signal – candle pattern, chart pattern or breakout. The goal is to hold every trade until a contrary RSI signal presents, or price movement confirms that the move is over.

Price Action Trading Strategy

This is the 30-minute chart of Bank of America.

The chart starts with the RSI in overbought territory. After an uptrend, BAC draws the famous three inside down candle pattern, which has a strong bearish potential.

With the confirmation of the pattern, we see the RSI also breaking down through the overbought area.

With matching bearish signals, we short BAC.

The price starts a slight increase afterward. Perhap we wonder if we should close the trade or not. Fortunately, we spot a hanging man candle, which has a bearish context.

We hold our trade and the price drops again.

Notice the three blue dots on the image. These simple dots are enough to confirm our downtrend line. After we entered the market on an RSI signal and a candle pattern, we now have an established bearish trend to follow!

Later on, the trend resists the price rally (yellow circle), and we see another drop in our favor. After this decrease, BAC breaks the bearish trend, which gives us an exit signal.

We close our position with BAC, and we collect our profit. This trade made us 20 cents per share.

Which Trading Strategy Is Best?

If you are new to trading, combining the relative strength index with another indicator like volume or moving averages is likely a great start.

Pairing with the indicator will give you a set value with you can make a decision. It also removes a lot of the gray areas associated with trading.

Once you progress in your trading career, you may want to look to methods using price action that are more subjective. At this point, you may be able to apply techniques specific to the security you are trading, which could increase your winning percentages over time.

But again, this level of trading takes a ton of practice over an extended period.

Examples of where the Relative Strength Indicator Fails

I think it’s important to highlight where indicators can fail you as a trader and the RSI is no different.

At best you may achieve a 60% win rate with any strategy, including one with the RSI.

With that in mind, let’s layout the likely ways the RSI could burn you when trading.

#1 – The Stock Keeps Trending

The textbook picture of an oversold or overbought RSI reading will lead to a perfect turning point in the stock. This is what you will see on many sites and is even mentioned earlier in this very post.

However, we all know things rarely go as planned in the market.

False Sell Signals
False Sell Signals

As you see, there were multiple times that BFR gave oversold signals using the relative strength indicator. The stock continued higher for over three hours.

So how do you avoid such an unfortunate event if you are going short in the market?

Simple, you have to include a stop loss in your trade. This will be a common theme as we continue to dissect how the RSI can fail you.

#2 – Divergences Do Not Always Lead to Meltdowns

The tricky thing about divergences is that the reading on the RSI is set by price action for that respective swing.

Unfortunately, there are times where the price action itself changes from one of impulse to a slow grind.

Divergence False Signals

To this point, look at the above chart and notice that after the divergence takes place the stock pulls back to the original breakout point. But then something happens, the stock begins to grind higher in a more methodical fashion.

If you are long the market, it doesn’t mean you should panic and sell if the high is broken with a lower RSI reading. What it means is that you should take a breath and observe how the stock behaves.

If the stock beings to demonstrate trouble at the divergence zone, look to tighten your stop or close the position.

However, if the stock blasts through a prior resistance level with a weaker RSI reading, who are you to stop the party?

#3 – Tight Ranges

Extreme Readings
Extreme Readings

In some RSI examples, you may find scenarios where the indicator bounces from below 30 to back above 70 violently.

Well, all you have to do is buy the low reading and sell the high reading and watch your account balance increase. Right? Not exactly.

There are times when the ranges are so tight you might get an extreme reading. But it might not have the volatility to bounce to the other extremity.

So, like in the above example, you may buy the low RSI reading but have to settle for a high reading in the 50s or 60s to close the position.

Conclusion

By now we hope you have a much better understanding of the relative strength index indicator. Here are a few important takeaways to remember for this tool:

  • The RSI is a momentum indicator.
  • RSI oscillates between 0 and 100 providing overbought and oversold signals.
  • Readings above 70 are considered bullish.
  • Readings below 30 are considered bearish.
  • John Hayden promotes two key levels of 33.33 and 66.66.
  • The default RSI formula is calculated based on:
    • Gains over the last 13 periods
    • Current gain
    • Average loss over the last 13 periods
    • Current loss
  • Stop loss orders are recommended when trading with the RSI.
  • RSI should be combined with other trading tools for better signal interpretation.
  • Some of the successful RSI trading strategies are:
    • MACD + RSI
    • MA Cross + RSI
    • RVI + RSI
    • Price Action + RSI

More Resources

For more information on the RSI, check out this YouTube video which provides further clarification.

On that note, if you are interested in a master class on the relative strength index, feel free to visit our friends over at Mudrex.

To practice all of the trading strategies detailed in this article, please visit our homepage at tradingsim.com.

It’s really easy to see the perfect RSI setups, but the real success begins once you practice how to handle the situations which you don’t expect. As with any strategy, we recommend a minimum of 20 trades before employing real money.

External References

  1. Relative Strength Index. Wikipedia
  2. Hayden, John. (2004). ‘John Hayden in his book titled ‘RSI: The Complete Guide‘. Traders Press, Inc. pg. 66
  3. White, Rocky. (2019). Trading the Relative Strength Index (RSI): Does it Work?. moneyshow.com

Liquidity is a measure of how easily one can buy and sell a position in the market, and it is a very fundamental element of trading, especially day trading. There are a few steps you can take in your day trading to make liquidity nothing but a small concern.

If your account is a boat, then liquidity is the stream. When you put that boat out onto the market’s waters, you expect to be able to move and turn as you wish.

The drier the stream, the slower the boat can move. And this can be dangerous, especially for larger boats.

When day trading, you need to make sure that your boat can always float easily and cleanly without being too large for the stream.

What is Liquidity?

Aside from the boat analogies, let’s use the real estate market. Certain times of the year, people are typically looking for homes to buy. This may fluctuate depending on the season, the location, the type of home, etc.

Ideally, you want a “liquid” home if you are trying to sell it. In other words, if your home is in the right market, the right spot, at the right time, you may actually find an offer higher than your asking price! And that’s great.

Compare that to a slow market.

Nothing is moving, nothing is selling. Your location is bad, and the house might need work. You go through agent after agent trying to sell your home.

Foreclosure for sale

Mark down after mark down, and you finally get rid of it for a loss.

The stock market is no different. And unless you are a long term investor willing to hold out through the dry spells, you want to avoid these markets.

For day trading, this can also spell trouble if you are oversized for the amount of liquidity available that day. Here are a handful of things that could go wrong:

  1. You won’t get filled when trying to sell limit orders.
  2. Market orders may experience massive slippage.
  3. You might ended up being a bag holder.
  4. You’ll be tempted to average down to support your position.

Like trying to sell a home in a bad market, you’ll try all kinds of gimmicks and tricks to get out of your position, only to lose.

Where to Find Liquidity

Just like finding a home in an up and coming neighborhood, within a popular city, in a growing area, you want to look for stocks with the same momentum.

Though volume and liquidity are not entirely related, liquidity is still most often found in markets and stocks with the highest volume. High volume means there is significant investment and speculative interest in a market.

At any given time, you should be able to buy into and sell out of positions at will.

Along those lines, high volume stocks, bonds, exchange-traded funds or currencies will have the greatest number of market makers.

Market Makers
Market Makers

This is important because they are matching buyers with sellers and ensuring the market flows easily.


Exchange Traded Funds (ETFs)

Exchange-traded funds can generally be a great source of liquidity to investors.

Since an exchange-traded fund is usually a combination of stocks or commodities bundled together and sold in a package, investment banks and algorithmic trading computers help keep the price of exchange-traded funds in line with their underlying products.

In doing so, hundreds of thousands of shares are bought and sold, adding to the number of buyers and sellers, and ultimately, day trading liquidity.

The popular SPY ETF, made to track the performance of the S&P500, generates daily volume of nearly 200 million shares.

In an eight hour trading day, that means that 25 million shares are traded per hour. This is 416,000 shares per minute or nearly 7,000 shares per second!

SPY 180 million share day.

Finding day trading liquidity here should not be an issue.

Be advised, however. There are some low volume and low liquidity exchange-traded funds. However, since these are often unprofitable for fund issuers, there are only a few on the market at any given time.

Most illiquid day trading ETFs are of the currency tracking variety.

Blue Chip Stock Liquidity

Blue chip stocks are also a common source for stock trading liquidity.

Popular names like MSFT, AAPL, GOOG, NFLX, among others, are a haven for day trading professionals.

They attract investment banks and other institutions that trade millions of shares per day.

Often, day trading professionals will pick a few stocks and trade them exclusively.

Most often these shares are those of larger companies like the ones mentioned above, or TSLA, GE, and others.

Low Float Stock Liquidity

For the most part, low float stocks have extremely low liquidity. However, there are occasions when these lower priced, lower float stocks have “outlier” days.

EYES "outlier" 500 million liquidity day
EYES “outlier” 500 million liquidity day

Like the example above, some news or event triggers an entourage of day traders chasing a fast buck. A stock like this, which was averaging only 500k shares per day, traded over 500 million in a single day.

The end result for these events can often be ugly. But for the nimble day trader, these can actually provide decent liquidity.

We cover a lot of this in our posts on Float Rotation and VWAP Boulevard, if you want to check them out.

Currency Markets Liquidity

The currency markets often have the best liquidity, as up to $3 trillion in currencies trade hands on any one day. Plus, since the currency markets attract worldwide interest, there are far more market actors and investors to buy and sell amongst each other.

Stocks, in contrast, usually attract mostly domestic interest.

Practice Scanning for Liquidity

Here at TradingSim, our built-in market scanner does most of the work for you. Aside from our custom scanner, we give you the ability to scan for the top performing volume profiles on any given day.

Top Volume filter for TradingSim Scanner

This gives you an advantage while practicing your day trading strategies by filtering out any lower liquidity stocks.

If that isn’t enough, we now offer the ability to filter your scan results by average daily volume, float, market cap, index and more!

TradingSim Scanner
TradingSim Scanner

Conclusion

Most traders should be able to find liquidity in the names and financial products they want to trade the most.

Since the invention of at-home and online trading, more traders have been brought into the markets. Most financial products attract enough interest to stay liquid, even little-known small caps these days.

Just be sure to check your position size, the spread on the bid and ask, and the average volume. This should keep your risk in check.

Stock Float Explained

Stock float is one of the most important metrics that can influence the price of a security. While it can be a confusing term to understand as a beginning trader, it is worth the effort to know. After all, it can mean the difference between big gains and big losses.

Why Stock Float Is Important

The more metrics you have to evaluate a security before trading it, the better. As a rule of thumb, anyway.

Perhaps you won’t be too concerned with a dividend if you’re only looking to day trade a specific stock. You won’t own the stock long enough for the dividend to matter.

But one metric that can dramatically affect a stock’s price movement and volatility, is the float.

Therein lies the importance of this numerical data.

The Role of Insiders

Of the number of shares that are tradable for any given security, those shares are either freely tradeable on the market or insider-owned shares that are locked up. That is, unless the insiders decide to sell more shares, which is another subject in itself.

For the most part, inside shares are owned by the employees of the company they work for. The insider owned shares are not easily tradeable as they come with restrictions. For that reason, the market at large doesn’t bother much about the insider owned shares.

On the other hand, free floating shares are owned and traded by general investors. Investors like you, perhaps.

Institutions

In many cases, institutions also own a majority of these publicly available shares. These institution-owned stocks are typically held for a long time. Examples of institutions include pension funds or hedge funds.

Because most institutional firms are not actively trading their portfolio every day, this leaves only a remaining portion of the overall shares of a company that are readily tradable.

What Is A Stock Float?

The float of a security measures the total amount of shares that can freely change hands. In many ways, it depicts the liquidity of the market for certain companies.

The more number of shares there are to change hands, the greater the liquidity.

Calculating Stock Float

To better understand “floating stock,” let’s illustrate this with an example.

A company ABC Inc. has 100,000 shares outstanding.

Of the shares outstanding, 5000 are held by its employees, 40,000 shares are held by institutions. The remaining shares are held by regular investors.

From this, the stock float is 55,000. This is the sum of the total outstanding shares minus the shares held by insiders and institutions.

Stock float explanation

As you can see, while the outstanding shares may be as high as 95,000 for this particular hypothetical company, the actual shares available at any given time, may be much lower.

Float Impact

The impact this has on stock prices and volatility can be dramatic. After all, it is supply and demand that dictate the prices of stocks.

To that end, if more and more institutions gobble up the oustanding shares of a company, it takes less and less demand for the price to rocket higher.

Scarcity of shares, as it were.

This is exactly what happens during the early period of a company’s publicly traded life.

Low Float Stocks

A low float stock as the name suggests indicates that the number of shares outstanding are low. For such stocks, the daily and average volume tends to be low. The low volumes of such stocks lead to volatility and as a result, wide bid and ask prices.

Before the company dilutes its value by throwing more shares into the market, the lower float in the beginning can cause its price to skyrocket as long as demand is there.

For such low float stocks, a fundamental driven rally creates demand. In other words, investors are stumbling over themselves to buy shares when they are scarce, driving the price higher in dramatic fashion.

Over The Counter Stocks

There is a myth that low float stocks are mostly stocks on the pink sheet or OTCBB market listings.

However, this is not the case. In some cases you can find some micro-cap stocks with listings on the main exchanges such as the NASDAQ or the NYSE. A stock can also be low float if for some reason the float reduces relative to its usual average.

While the definition is a bit flexible, a stock is considered a low float stock which has fewer than 50-100 million in tradable shares.

High Float Stocks

Stocks with a high float tend to be more predictable and less volatile. For all intents and purposes, you can expect a stock to be a “high float stock” with anything above 100 million available shares.

Due to the large number of shares in the float, the liquidity can absorb any big moves. Therefore, while it is common to see 30% or 40% or even 100% moves during a short amount of time in a low float stock, this is not often seen with high float stocks.

The lack of scarcity means the value is often at “equilibrium” with the amount of shares being traded. Thus it takes more effort to move the price.

Larger companies such as AAPL or FB are examples of stocks with high float.

Comparison Between High and Low Floats

To imagine the difference, lets take a stock with a float of 18 million and 23.5 million outstanding shares, and compare it with AAPL at 16.68 billion float and 16.75 billion shares outstanding.

EYES ran 1293% in just 4 trading days:

EYES 1293% small stock float example
EYES small float stock example

AAPL moves 18% in 38 trading days.

Large stock float example
AAPL large float stock example

Clearly, there is a difference. For most investors or traders, it is usually a safe bet to trade stocks that have a higher float.

Trading low float stocks can be lucrative in the short run, but they typically come with the headaches of volatility and a lack of secure fundamentals.

Market Cap vs. Free-Float Market
Cap

Market capitalization, or market cap for short, is closely linked to the free float of the stock.

When researching stocks, companies are usually categorized based on their market capitalization. Pull up any ticker on finance.yahoo.com or any other site, and you’ll see Market Cap at the top of the list, usually:

Yahoo Finance Market Cap for AAPL
Yahoo! Finance Market Cap for AAPL

The important question for traders, is whether you should pay attention to this.

Market cap is a measure of a company’s size: the total value of a company’s outstanding shares of stocks. These outstanding shares include publicly traded shares as well as restricted shares that are held by insiders.

How To Calculate Market Capitalization

To calculate market capitalization you simply take the number of a company’s shares that are outstanding. Multiply the shares outstanding by the current stock price in order to get the market cap of the stock.

Let’s illustrate this with a simple example.

Say a company ABC Inc. has a total of 5 million shares outstanding. If this company is trading at a stock price of $10, you can get the market cap by multiplying the shares outstanding with the stock price.

In this example, we get $50 million as the market capitalization of the company.

Within market capitalization, there are certain classifications. The different categories can vary depending on who you ask. However, market capitalization is broadly classified into the following:

Now that we understand what market capitalization is, we can see the difference.

Market cap is based on the total value of the company’s shares.

Float is the number of outstanding shares that are available for general trading by the public.

The Free Float Market Cap Calculation Method

There is also another measure called the free float market cap method of calculation. In the free float calculation method, the market cap excludes shares that are locked in. The shares that are locked in are inside shares that are not available for the general public.

Generally, the free float method of calculating the market cap is widely used. Major indexes such as the Dow Jones Industrial Average and the S&P500 make use of the free float method.

Free float and market cap are important metrics for investors. When combined together, these two values show the total available shares for the public to trade.

Stock Price Manipulation Through Float

One common question among traders is whether one can manipulate the price of a stock based on the float.

As mentioned above, a reduction in the float can almost immediately raise the price of a security. This might seem contrary to the notion of “higher the float, bigger the price.”

This is not the case however. For example, when risk averse investors are on the short side of the stock, reducing the float can squeeze these investors out of the market.

This research paper of Float manipulation and stock prices gives insight into how firms can expand or shrink the float. The researchers observe Japanese stock listings and the price impact of firms who reduce their float between 0.1% up to 100% for periods of one to three months.

The study concludes that the price of a stock tends to rise when the float is reduced and conversely, the price of the stock falls when the float is increased.

The returns of the stock are also said to be cross-sectionally related to the reduction in the float.

There is strong evidence that firms tend to issue equity or redeem their convertible debts when the float is low. After all, they want the highest price they can get for their shares.

For this reason, firms have strong incentives for manipulating the stock price via its float.

Can A Company Increase or Decrease Its Float?

The answer to this is yes. Companies can raise or decrease their float in a handful of ways.

  • A company can raise the float by issuing new shares and it can reduce the float by announcing buy back of its shares.  Other examples include a company announcing a stock split which could impact the float.
  • Insider activity is also one of the factors influencing the float. For example, insiders who usually own options can choose to exercise their option. This can also influence the float. However, for this to occur there needs to be a significant amount of option exercises.
  • A company can also increase its float by deciding to sell some of the inside shares. This is done for legitimate reasons such as raising cash, but there could also be ulterior motives.
  • Typically, you can see the float changing when there are some big changes. The trigger for the changes to the float can be due to the fundamental drivers such as news events or company reports and rumors.

Pros and Cons of Trading Low Float Stocks

As you might expect by now, there are pros and cons when it comes to trading stocks with a low float. For a more in depth look, be sure to check out our post on Float Rotation.

Let’s talk about the upside first!

Pros

Because low float stocks are volatile, there is a tremendous upside to the stock. Traders who can take a calculated risk on low float stocks could end up with big returns.

Despite the inherent risks, traders can find an occasional good trade with tremendous upside potential in low float stocks. One of the important things to look for is liquidity.

Cons

In many ways, trading low float stocks can be similar to trading penny stocks or micro-cap stocks.

Low float stocks can be very risky to hold because they can have violent moves in either direction. With so few shares available to trade, the impact on supply and demand can be significant.

Low float stocks can be easy to manipulate with large unexpected orders. This is something that investors need to bear in mind.

Stocks with low floats also tend to be volatile around fundamental news releases. These include any type of news that is related to the industry or the sector in particular. Liquidity also increases around such events which can give good opportunity for investors to exit the stock after making a good trade.

Be sure to check for any filings with the SEC as these companies tend to offer shares during price spikes.

How To Find Float Data

There are a number of services that offer float data. Yahoo Finance and Finviz are just a few of the popular ones. Popular charting platforms may offer this as well, usually with a subscription to fundamental data.

Here is a snapshot of some of the fundamental data that finviz.com provides free of charge:

finviz.com float data
finviz.com fundamentals data

Regardless of the service you use, you may find some discrepancies from one to the next.

Conclusion

Hopefully this helps fill in some gaps when it comes to stock float and the impact it may have on your trading.

As with any piece of information in the markets, it is always wise to study the context and historical examples. Here at TradingSim.com, we can help with this as we have the ability to filter your search for simulated trades based on float size.

Hopefully you’ll take the time to develop your playbook and decide whether you like the price action and risk of low floats or high float stocks.

Best of luck!

Candlestick Pattern Quick Reference Guide

Trading without candlestick patterns is a lot like flying in the night with no visibility. Sure, it is doable, but it requires special training and expertise. To that end, we’ll be covering the fundamentals of candlestick charting in this tutorial. More importantly, we will discuss their significance and reveal 5 real examples of reliable candlestick patterns. Along the way, we’ll offer tips for how to practice this time-honored method of price analysis.

Also, feel free to download our Candlestick Pattern Quick Reference Guide!

Why Do Candlestick Patterns Matter?

After all, there are traders who trade simply with squiggly lines on a chart. Astonishingly, some don’t even look at the charts! Instead, they pay attention to the “tape” — the bids and offers flashing across their Level II trading montage like numbers in The Matrix.

Level II montage gif
A Level II montage. Source: CenterPoint Securities

No doubt, there are countless ways to make money in the stock market. In fact, there is no right or wrong way to read a chart. But unless you are just a gambler, you need some form of data to make informed decisions.

We believe the best way to do this is by understanding candlestick patterns.

For newer traders, even reading candlestick charts can seem like an insurmountable learning curve. There appears no rhyme or reason, and no end to the amount of price and volume data being thrown your way.

It’s daunting, for sure. Especially when you’re just getting started.

But be of good cheer! There is a method to the madness. The method is in the patterns. The patterns reveal probabilities. And the right probabilities create opportunities.

More importantly, the right opportunities can create profits.

This is where candlestick patterns come in handy. They help us to decipher the patterns of the market. They’re like little road signs on crowded streets. And with enough repetition, enough practice, you just might find yourself a decent chart reader.

That’s why you’re here, right? To learn to navigate the murky waters of the market?

Trust us, it is a worthwhile endeavor.

Who Discovered the Idea of Candlestick Patterns?

According to Investopedia.com, it is commonly believed that candlestick charts were invented by a Japanese rice futures trader from the 18th century. His name was Munehisa Honma.[efn_note]Farley, A. (2021, April 29). The 5 Most Powerful Candlestick Patterns. Investopedia.Com. https://www.investopedia.com/articles/active-trading/092315/5-most-powerful-candlestick-patterns.asp.[/efn_note]

Honma traded on the Dojima Rice Exchange of Osaka, considered to be the first formal futures exchange in history.[efn_note]NinjaTrader. (2019, April 17). Candlestick Charting: Legend of Munehisa Homma. NinjaTrader.Com. https://ninjatrader.com/blog/candlestick-charting-legend-of-munehisa-homma/.[/efn_note]

As the father of candlestick charting, Honma recognized the impact of human emotion on markets. Thus, he devised a system of charting that gave him an edge in understanding the ebb and flow of these emotions and their effect on rice future prices.

Honma actually wrote a trading psychology book around 1755 claiming that emotions impacted rice prices considerably.[efn_note]Beyond Candlesticks: New Japanese Charting Techniques Revealed, Steve Nison , Wiley Finance, 1994, ISBN 0-471-00720-X.[/efn_note]

When all are bearish, there is cause for prices to rise.

Munehisa Honma[efn_note]Beyond Candlesticks: New Japanese Charting Techniques Revealed, Steve Nison , Wiley Finance, 1994, ISBN 0-471-00720-X, p14.[/efn_note]

In recent history, Steve Nison is widely considered the foremost expert on Japanese candlestick methods. After all, he wrote the book that catapulted candlestick charting to the forefront of modern market trading systems.

Beyond Candlesticks: New Japanese Charting Techniques Revealed, is one of his most popular books and a definitive resource for candle patterns.

Since the 90s, this method of charting has become pervasive throughout all financial markets: equities, futures, forex, and more.

In his books, Nison describes the depth of information found in a single candle, not to mention a string of candles that form patterns. It truly puts the edge in favor of a skilled chartist.

The Story That Candlesticks Tell

Candlesticks are telling us a story. The story is a reflection of what buyers and sellers are doing.

Emotions and psychology were paramount to trading in the 1700s, just as they are today. This is the foundation of why candlesticks are significant to chart readers.

How so?

Every candle reveals a battle of emotions between buyers and sellers.

As the great trading psychologist Brett Steenbarger notes, “proper training is the best source of discipline and the most effective safeguard against intrusive anxiety and impulsivity.”

With this in mind, understanding the emotional story within candlesticks is a great place to start that training.

How are Candlesticks Formed?

There are three types of candlestick interpretations: bullish, bearish, and indecisive. This is painting a broad stroke, because the context of the candle formation is what really matters. But for all intents and purposes, we’ll stick with these three categories.

The elements of a candlestick graph
The elements of a candlestick

What Is a Candlestick?

The formation of the candle is essentially a plot of price over a period of time. For this reason, a one minute candle is a plot of the price fluctuation during a single minute of the trading day. The actual candle is just a visual record of that price action and all of the trading executions that occurred in one minute.

Similarly, a daily or weekly candle is the culmination of all the trading executions achieved during that day or that week.

The open tells us where the stock price opens at the beginning of the minute. The close reveals the last recorded price of that minute. The wicks (also known as shadows or tails) represent the highest and lowest recorded price from the open and close.

According to Nison, the Japanese placed much less emphasis on the highs and lows of individual candles. For them, as it is for modern technicians, the opening and closing prices were more relevant.[efn_note]Beyond Candlesticks: New Japanese Charting Techniques Revealed, Steve Nison , Wiley Finance, 1994.[/efn_note]

Essentially, the broader context of candles will paint the whole picture.

What Is a Bullish Candle?

A bullish candle is formed when the price at the closing of the candle is higher than the open. This can be on any time frame: from a 1-minute candle to a 1-month candle. It will all be the same.

A bullish candle explanation
A bullish candle opens low and closes high.

Typically these candles close with a green or white body color, though most charting platforms allow for customization these days.

What Is a Bearish Candle?

Conversely, a bearish candle is assumed when the closing price is lower than the opening price. In other words, the price dropped in the amount of time it took for the candle to form.

A bearish candle explanation
A bearish candle opens high and closes low.

By default, most platforms will show a red or black candle as bearish.

What Does the Candle Formation Tell Us?

This is the real question we need to ask ourselves. It isn’t enough to know that the candle opened and then closed lower, or vice-versa.

As renowned trader and best-selling author Dr. Alexander Elder explains, “The main advantage of a candlestick chart is its focus on the struggle between amateurs who control openings and professionals who control closings.”[efn_note]Elder, A. (2014). The New Trading for a Living: Psychology, Discipline, Trading Tools and Systems, Risk Control, Trade Management (Wiley Trading) (1st ed.). Wiley.[/efn_note]

Dr. Elder may be referring to daily candles, but his point is still important. The candle represents a struggle between buyers and sellers, bulls and bears, weak hands and strong hands.

Every trader wants to understand the price action and read it well to improve their trading. Studying candlestick patterns helps us understand the price action and where the stock is more likely to go the next minute or the next few minutes.

Armed with that knowledge, let’s dig in and see what picture those little candles are trying to paint for us.

The High of the Candle

The high of each candle, whether it is the tip of the wick at the top, or if the body closes at the top, represents the maximum effort of bulls. If it is a daily candle, buyers could not push the price of the stock one cent more during that day.

Why is that important? There are two reasons:

  1. This could represent a near term level of resistance which will have to be broken for the price to move higher.
  2. In order to find enough demand to push through that resistance, the stock may need to consolidate lower until enough shares are accumulated.
Inside a bullish candle pattern

The Low of the Candle

Just as the high represents the power of the bulls, the low represents the power of the bears. The lowest price in the candle is the limit of how strong the bears were during that session.

Why is this important? Again, two reasons:

  1. This could represent a near term level of support where bulls were able to stop the downward momentum
  2. To move lower, more supply may need to enter the market at higher prices.
Inside a bearish candle explanation

The Closing Price of Each Bar

This is where the story gets interesting.

When a candle closes above its opening price, we can assume that the bears won in some form or fashion. How much it closes above the open tells us with what intensity the bulls were in control during that session.

Let’s look at few examples to better understand this:

In this chart, we see the “Three White Soldiers,” which is a candlestick pattern describing three bullish candlesticks in a row. What can we interpret from this?

Three White Soldiers candlestick pattern

It is clear to see that the candles open low and close high. Bulls were clearly in control during each session with very little energy from the bears.

Now contrast that with what we see in the next example. Ask yourself, who was in control during this session?

Bullish Doji Candle explanation

Apparently there is indecision as to who is in control. How do we know? Think about the story behind this “Spinning Top” candle:

The stock opens, proceeds lower as bears are in control from the open, then rips higher during the session. But after putting in a decent high, the bulls settle back and give the bears some control into the close.

Are you beginning to see how the story unfolds?

These are the stories that candles tell us on charts. Who is in control (greed), who is weak (fear), to what extent they are in control, and what areas of support and resistance are forming.

The Range between the Open and Closing Price

This is one of the most important aspects of interpreting candles. As Dr. Elder notes, the range between open and close “reflects the intensity of conflict between bulls and bears.” [efn_note]Elder, A. (2014). The New Trading for a Living: Psychology, Discipline, Trading Tools and Systems, Risk Control, Trade Management (Wiley Trading) (1st ed.). Wiley. p 53.[/efn_note]

In day trading, momentum is everything. On this token, the character of the candles can tell us if there is demand or if a stock is sleepy and uninteresting — whether we are about to launch, fall off a cliff, or just grind sideways.

Additionally, the nature of the candles can tell us when to enter with tight risk. Or, when to take profits into climactic candles.

In the end, it all boils down to context and the story of buyers and sellers behind the tape.

5 Real Examples of Reliable Candle Patterns

Without practice, none of this information really matters. It takes screen time and review to interpret chart candles properly. There are no free lunches in the markets.

With that being said, let’s look at some examples of how candlestick patterns can help us anticipate reversals, continuations, and indecision in the market.

1. The Hammer / Hanging Man

The hanging man  occurs at tops and the hammer occurs at bottoms.

The Hanging Man is a candlestick that is most effective after an extended rally in stock prices. The story behind this candle tells us that there were extensive sellers in the formation of the candle, signified by the long wick.

It is usually accompanied by heavy volume.

The Hanging Man pattern
The Hanging Man appears at the top of an extended uptrend before reversing.

The Hammer is another reversal pattern that is identical to the The Hanging Man. The only difference is the context. The Hammer occurs at the end of a selloff, signifying demand or short covering, driving the price of the stock higher after a significant selloff.

Like the Hanging Man, you want to see a solid volume signature associated with these candles.

The Hammer pattern
Hammer candles appear at the bottom of a downtrend before a reversal

2. Engulfing Patterns

Engulfing patterns offer a great opportunity to go long while keeping risk defined to a minimum. As you can see in the example below, the prior bearish candle is completely “engulfed” by the demand on the next candle.

A bullish engulfing candlestick pattern
A bullish engulfing candle at the market open.

Another example of engulfing patterns is the Bearish Engulfing Sandwich. Here we have what appears to be a bearish reversal, but the next candle completely swallows the supply from that red candle:

A bearish engulfing sandwich, also know as a stick sandwich
A bearish engulfing sandwich pattern, also know as a stick sandwich

3. The Morning Star

The Morning Star is yet another reversal signal. It can be found at the end of an extended downtrend or during the open. It takes 3 candles to confirm the setup.

  1. The first candle must be a strong downtrending candle.
  2. The second candle is the star. It’s usually a narrow body candle that, ideally, does not touch the body of the prior candle.
  3. The third candle is a strong bullish candle confirming the new uptrend.
The morning star candlestick pattern explained at the open
The morning star candlestick pattern at the open

4. The Evening Star

Similar to the Morning Star, the Evening Star is its bearish cousin. It forms at the top of parabolic or extended bullish runs. Much like the Morning Star, the body of the candles should not touch.

Here are three criteria for spotting the shooting star:

  1. The bodies do not overlap
  2. The third candle is a strong bearish candle closing into the body of the first candle
  3. Volume should increase from left to right in the pattern
The Evening Star explained on GME
The Evening Star candlestick pattern on GME

As with all of these formations, the goal is to provide an entry point to go long or short with a definable risk. In the example above, the proper entry would be below the body of the shooting star, with a stop at the high.

5. Indecision Candles

The doji and spinning top candles are typically found in a sideways consolidation patterns where price and trend are still trying to be discovered.

Indecision candle patterns
Indecision candlestick patterns

The “doji’s pattern conveys a struggle between buyers and sellers that results in no net gain for either side,” as noted in this great article by IG.com.

Will it continue upward? Go sideways? Or reverse?

With indecision candles, we typically need much more context to answer these questions.

The Gravestone Doji is a perfect example of this:

The Gravestone Doji indecision candlestick explanation
Gravestone Doji candles can represent indecision on a chart.

Note the trend is mostly sideways in this first circled example. For this reason, waiting for the reaction to these candles is usually best for risk management.

Eventually, the price falls in this particular case as the trend becomes more extended into the rally. Correspondingly, the Shooting Star that occurs just beyond the Gravestone Doji is confirmation of that falling price action.

The Best Way to Practice with Candlestick Patterns

As always, it is best to practice a strategy before putting money to work in the market. There is no better way to do this than with a simulator.

One of the best methods to train your “chart eye” to see these patterns is to simply replay the market, noting each time you see a particular candle.

As you put in deliberate practice, ask yourself the following questions:

  • What candle formation is this?
  • What is the context? Uptrend? Down trend? Sideways?
  • Does this candle meet the criteria for a proper reversal?
  • Where could I enter with the least amount of risk?
  • What would confirm the pattern?

We have a wealth of knowledge on many different candlestick patterns, so be sure to check out those lessons, too!

Bullish Two-candle Patterns

A proper education in price action wouldn’t be complete without understanding when, how, and where to go long on a stock. Especially using bullish candlestick patterns.

While we’ve discussed some of the history of candlesticks in other recent posts, and outlined the 8 most popular bearish candlestick patterns, today we’re going to talk about the following:

  1. The Hammer
  2. Bullish Engulfing Crack
  3. Bearish Engulfing Sandwich
  4. Morning Star
  5. Tweezer Bottom
  6. Piercing Line

In addition, be sure to use our Bullish Candlestick Pattern Cheat Sheet for your trading and training purposes as you read along!

Bullish Candlestick Patterns Cheat Sheat

Bullish Candlestick Patterns Explained

Let’s face it. Day trading is difficult. It can be fast and furious, especially for beginners.

Stocks are up one minute, down the next. You want to get in at the bottom, but you’re unsure of yourself. You want to short the top, but how do you know it will come back down?

Not knowing how to make sense of charts in the heat of the battle only adds to the difficulty of day trading.

Thankfully, a lot of the work has been done for us – four centuries ago, actually. It is simply up to you to put in the time to understand price action trading.

Therein lies the importance and functionality of bullish candlesticks and candlestick patterns.

In this post we’ll explain the most popular bullish candlestick patterns. For each pattern, we’ll cover:

  1. What these patterns look like
  2. How to set entries and risk for each
  3. What are the criteria for confirming them
  4. What story do they tell
  5. Some common mistakes when interpreting them
  6. A few strategies for each

1. The Hammer

Hammer Candle Pattern

If you are familiar with the bearish “Hanging Man”, you’ll notice that the Hammer looks very similar. But as the saying goes, context is everything. Much like the Hanging Man, the Hammer is a bullish candlestick reversal candle.

The context is a steady or oversold downtrend. This creates the plot for the story that builds within the next few candles. As price declines more rapidly, we anticipate the eventual bounce.

But how do we anticipate without getting caught in more of the selloff?

This is where the Hammer comes into play. It offers us evidence that selling pressure is diminishing or being absorbed. In addition, if the volume signature associated with the Hammer candle is significant, it adds even more confidence to our thesis.

We are looking to capitalize on shorts who are taking their profits and covering, along with dip buyers who are taking a chance here on the oversold conditions. The expectation? A rally.

Ideally, you identify the hammer candle, take a position long on the break to the upside of the candle, and set a risk in the body of the Hammer, or at the lows.

Bullish Hammer Example

Let’s look at a real-life example with PLUG. Right off the open, PLUG retests the lows from the pre-market. Once it reaches those levels, volume increases slightly as it reverse on the 5-minute chart seen here.

Real example of a bullish Hammer candlestick pattern
PLUG reversing in the first 30mins of trading with a Hammer candle pattern

Visibly, there is a “shelf” forming near the lows of the hammer candle’s body. The bar to the left and right also close and open in that price “shelf” area.

The second 5-minue chart opens with a bit of weakness, then rallies strongly above the Hammer candle.

This is your signal to go long. The break of the Hammer candle body.

Set the stop below the close of this bullish 5-minute candle.

2. Bullish Engulfing Crack

Bullish Engulfing Candle Pattern

Imagine the surprise if you are a short seller when a stock appears to confirm your downward thesis, only to completely reverse on you. Such is the case with the Bullish Engulfing Crack.

The down trend appears to be continuing. Shorts are nice and comfortable. Then suddenly we get a complete retracement of the preceding bearish candle.

How do we explain this?

Well, you can imagine that shorts will begin covering as they witness the rising price of the stock. This adds fuel to the buying pressure already present.

The result is a bullish candlestick pattern that engulfs the efforts of the bears. For the long-biased trader, the opportunity is perfect.

As with any setup, we are looking for evidence to build our confidence in either direction. The fact that bears were completely overcome in this single bar, is evidence enough for us.

You go long at the break of the prior bar, and set a stop at the lows.

Bullish Engulfing Examples

Let’s use PLUG as another example, on the same day as the prior example.

This time, later in the day, PLUG has a sharp selloff. After the steep decline, price reaches the support level from the prior Hammer candle mentioned above. This time, we get two bullish reversal candles that completely engulf the prior bearish candles.

PLUG with a bullish engulfing candlestick pattern
PLUG with a Bullish Engulfing Crack reversal pattern mid-day

Again, notice that the context is everything here. We are in an oversold condition with climactic selling pressure. Analyzing the volume at the lows, we can see that support is coming in as weak hands cough up their shares.

Let’s look at another example.

Here is a snapshot of TLRY, which offered us a beautiful Opening Range Breakout (ORB) opportunity right out of the gate on this particular day:

TLRY Opening Range Breakout and Engulfing Bullish candle example
TLRY with the ORB off the open using a Bullish Engulfing Crack pattern

After the selloff, buyers come in and overcome the prior selling pressure from the pre-market, engulfing the bears before moving higher.

To be safe, you would enter long on the break of the red candle, setting your risk at the lows, or in the body of the first green candle.

There are some advanced traders who are more aggressive and may take their positions early if they sense the reversal is imminent.

3. Bearish Engulfing Sandwich

Do not be confused. Just because the name says “bearish” doesn’t mean this is a bearish pattern. Far from it, actually. It is often referred to as the Stick Sandwich

The name is derived from the sandwiching of a “bearish engulfing” candle by two bullish candles. Thus, it is a bullish candlestick pattern in this context.

Very similar to the above example of the Bullish Engulfing Crack, this pattern simply takes a bit longer to “get going,” so-to-speak. An extra bar, essentially.

Again, the idea here is to think about who is getting trapped. In this case, the bears think that they have won the battle.

The assumption is that the trend has reversed and we are now headed down. After all, the Bearish Engulfing candle gives us that confidence, right?

Well, if you are on the short side, that is the hope. However, stocks don’t always do what we want them to. We have to react to what the market gives us, not what we think should happen.

In this case, the Bearish Engulfing Crack is consumed by two bullish candles that resolve to the upside. If you are short, hopefully you have respected your stop loss. If you are long-biased, you have a great opportunity here.

Bearish Engulfing Sandwich Example

PLTR offers a great visual of this in real-time after the open with a 5-minute candle chart.

PLTR Bearish Engulfing Sandwich
PLTR with a Bearish Engulfing Sandwich at the opening bell

In this case, the right side of the sandwich acts very similar to a Bullish Engulfing Crack candlestick pattern. For all intents and purposes, you should treat your entries and risk similarly to that pattern.

4. The Morning Star

Morning Doji Star and Morning Star Candlestick patterns


Technically speaking, the morning star should gap down. This is difficult to find on an intraday basis. For that reason we suffice for solid doji candle reversal pattern.

The initial candle should be long-bodied and bearish. The middle candle is short-bodied. The reversal candle is another long-bodied bullish candle (typically a gap up). The close of this bullish long-bodied candle should close above the midpoint of the 1st candle.

What is the story behind this pattern?

The plot is typical: oversold conditions (the gap down). But the body of the middle candle tells us that there is either indecision, or lack of follow through to the downside.

The result: without further selling pressure, the candle rallies to higher prices as sellers cover and buyers take advantage of discounted stock pricing.

Morning Stars can also appear as Morning Doji Stars. They look almost identical except for the body of the middle candle. The story of buyers and sellers remains the same.

Bullish Morning Star Example

You can see this in action with the PTON example below. A long bodied bearish candle, followed by a narrow bodied indecision candle. The bulls take control on the next candle and the rest is history.

PTON Morning Star Example
PTON displaying a Morning Star reversal pattern

It is worthwhile to note the volume in the first candle. We cannot assume that it is completely bearish. As you can see, there is some buying pressure at the lows. This gives us confidence as the doji candle forms.

Consequently, as price moves away from the lows in the green candle; it does so on low volume.

How can we explain that?

It took less effort for the price to rise. Therefore, we can assume that there is “ease of movement” to the upside. This should give us confidence in our long position.

For more examples of the Morning Star and other doji candles, visit our tutorial.

5. Tweezer Bottom

Tweezer Bottom Candlestick Pattern

The Tweezer Bottom bullish candlestick pattern consists of two candles– usually with small bodies. The first should be a red/bearish candle, the second a green/bullish candle.

The bodies of the candles are typically very close with regard to their closing and opening prices, or wicks. This produces a “visual” of a pair of tweezers.

Thematically, the Tweezer Bottom alerts the chart reader to the fact that price is trying to be pushed lower, but to no avail. The two small-bodied candles represent the presence of demand in the market.

The volume signature will likely appear elevated as supply is being absorbed, keeping the candles small in the presence of selling pressure.

Entry should be taken as price breaks higher from the second candle. Stops can be set at the lows.

Bullish Tweezer Bottom Example

BNGO displays a beautiful Tweezer Bottom candlestick pattern for us here on the 5-minute chart. Pay close attention to the narrow body of the two candles, their symmetry, and the red to green close.

BNGO with a Tweezer Bottom reversal pattern

The volume is of particular interest on this first red doji. Notice how elevated it is here. Given the context, we can interpret this as absorption of supply.

The second candle (green) then diminishes rapidly in volume. Thus, our thesis is confirmed that selling has been absorbed and exhausted.

And what happens in the absence of selling pressure?

The price of the stock rises.

6. Piercing Line

Piercing Line Candle Pattern

The Piercing Line can look very similar to a Bullish Engulfing pattern. The exception is that the Piercing Line doesn’t completely engulf the prior candle.

It is still considered a bullish candlestick pattern because it overcomes the downward momentum to close at least midway into the body of the previous candle.

Hence the name: it pierces the lower line, but inevitably retracts.

The entry is on the next candle, confirming the uptrend, with a stop at the lows

Bullish Piercing Line Example

Piercing Lines can offer a great risk to reward at the lows of support. They can even act like springs in trading ranges.

This 5-minute chart of BB shows a combination of an Opening Range Breakout (ORB) with a Piercing Line. Together, it is a combination that can really add confidence to our entry.

BB Piercing Line and Opening Range Breakout Strategy
BB with an ORB and Piercing Line pattern

As with any setup, the more evidence we have to confirm our bias and plan, the better. For this reason, it is always good to ask yourself:

  • Is the trend in my favor?
  • Is it time for a reversal?
  • Does volume confirm my thesis?
  • Is the stock at an area of support or resistance?
  • Do multiple timeframes align with my idea?
  • What will I risk to, and where should I target for profit taking?

Your criteria may be more involved, but the idea is the same. Candlestick charts are just a last line of confirmation for a overall plan of attack.

Think of them like an extra indicator.

Conclusion

You may be asking yourself, “How do I recognize these patterns in real time?”

That’s a great question.

The answer lies in practice, practice, practice. Trading Psychologist Brett Steenbarger, Ph.D., believes that this is exactly “how expertise is created.” According to him, if we turn trading into a series of performance drills, it can increase our chances of consistency.[efn_note]Steenbarger, B. (2014, November 14). The One Trading Drill That Can Most Improve Your Trading Performance. TraderFeed. https://traderfeed.blogspot.com/2014/11/the-one-trading-drill-that-can-most.html.[/efn_note]

You may be thinking, well I don’t have the luxury of 10,000 hours of practice. And that may be true. You have a job, kids, obligations, whatever the case may be.

But as Steenbarger notes, if you can drill down the process to specific repeatable patterns, you can achieve mastery much faster.

There is no better way to do this than training your “chart eye” with a stock simulator.

How does this work?

Build Your Mental Repertoire

Imagine being able to replay three years worth of stock trading days.

For each “training” session, you decide to focus on a single candlestick pattern. As you click through the stock charts for any random day, you look for examples of that one pattern. Over time you save a repertoire, mentally (and digitally if you can take screen shots).

Once you feel you can recognize this pattern, you practice it in replay mode. You spot the pattern, you make the trade. You make notes on what confirmed the pattern, what was the context, what you did right and what you did wrong.

Then, you move on to the next pattern.

Repeat.

This is what we call deliberate practice. And it pays off in the end.

Want to learn more about Candlestick Charts? Check out our free resources here.