Days to Cover Explanation & What It Means for Short Squeezes
Category: Basics of Stock Trading
Considering stock trading but unsure of where to start? Well you can begin by browsing over 30+ posts detailing how to get started in trading. Posts range from how to open a brokerage firm to specific trading strategies with entry levels and profit targets.
Stop feeling overwhelmed about the idea of becoming a retail trader. Start gaining the knowledge and understanding of the markets today that can help you become successful.
Definition of Days to Cover
Days to cover is a formula which tracks the number of shares short in the market relative to the available float. This allows a trader to see how bearish or bullish traders are on a security. The last component of the ratio is the amount of daily volume.
If you know the number of shares short and compare that to the average daily volume, you can estimate how long it would take for the short sellers to exit their positions. This ratio gives a trader a rough estimate of how much buying pressure is present in the market for a security. It also gives an indication of potential liquidity traps, which can lead to huge short squeezes.
Formula for Days to Cover
The below formula displays how to calculate the days to cover ratio:
Days to Cover Formula
Where to find Short Interest Data
Short interest data is tracked daily by the major exchanges, but is only released bi-weekly to the public. One of the best places to find the days to cover data is http://www.shortsqueeze.com/. The site has a simple tool that works like a ticker where you type in a symbol and it returns the days to cover information and a number of other ratios. The beauty of this is you do not have to go to multiple websites to get the days to cover information from each exchange.
Many brokers will also share this information. For example, a free WeBull account shows the short interest and days to cover as a graph, like this:
Days to Cover and short interest from WeBull
This chart shows the days to cover on the left, and the actual number of shares short on the right. This, of course, is only updated twice per month. For that reason, it’s best to consult a chart and consider more recent volume and price action.
How to trade with Days to Cover info
The days to cover does provide some insight into the relative strength of a potential short squeeze.
Stocks that have double digit days to cover ratios are often prime targets for speculators. But, traders have to realize that every stock that has been beaten appears ready for a bounce. To simply look at the days to cover ratio and buy the stocks with the highest number is a recipe for disaster.
Traders have to not only look at the ratio, but also the technical formation which precedes your entry. If you see climatic volume and a sharp price reversal, odds are you may have a good entry.
Short Interest Table
Below is a historical short interest table for Federal Home Loan Mortgage Corporation (FNM). Notice how the stock had a days to cover value of 9.21 at the end of May which ultimately led to a swift sell off.
Days to Cover Table
AMC Short Squeeze Example
Short squeezes are more likely to occur on small cap stocks than large caps. That doesn’t mean that large caps are immune to short squeezes, it is just that large caps need significantly higher pressure to squeeze the float (number of outstanding shares).
That being said, AMC was one of the more famous short squeezes recently, along with GME and SPRT. Let’s walk through a short squeeze example where AMC rapidly shifted from a bearish to bullish sentiment.
Short Squeeze
This is the daily chart of AMC in 2021. Now have a look at the historical short volume in AMC for early 2021:
AMC short interest
If the print is too small, the spikes in February and March coincide with around 100+ million shares short. Compare this with the corresponding spikes on the price chart shared above. Here is a nice overlay view:
Overlay of short volume and AMC chart
Now, if you consider that AMC has around 450m shares in the float, the compounding effect of 100s of millions of shares short can add up quickly. If price never recedes to allow these shorts the ability to cover over time at lower prices, the effect can be devastating.
Assuming that there were a couple hundred million shares short before the squeeze, the average daily volume before that period was around 40 million shares. Using our formula above, that gives us about 5 days to cover. Sure enough the upward momentum of the squeeze lasted about 6 days total.
Granted, all of this has to be pieced together unless you have access to real-time shorting data.
And from the results above, you can see that there were plenty of shorts to fuel the demand behind the squeeze from $10 to $70.
SPRT Short Squeeze Example
SPRT was another fantastic example of a short squeeze with high days to cover in 2021. Notice that the Days to Cover reached about 8 days back in May of 2021, while short interest was steadily climbing upwards of 3m shares or more.
SPRT days to cover and short interest data from WeBull
As the short interest rose, at one point it reached at least 78% of the float according to research done by Benzinga at the time.
Benzinga.com article excerpt
As you can imagine, the stock was poised for a short squeeze. However, we need to see the chart to really time our entries. Let’s go back and look at SPRT from this time period:
SPRT with high days to cover and huge short interest
Compare this chart of SPRT with the AMC chart above. Notice how we get a huge volume increase, then liquidity dries up considerably. This is a big indicator of whether or not a stock with a high short interest has “time” enough to let shorts out of their positions without exponentially moving the price of the stock.
As price rises, you’ll often see the shorts “averaging up” with daily candles that appear to be huge selloffs. But if the watermark gets too high, the shorts are stuck and forced to liquidate.
Finding Short Squeeze Candidates Using the Liquidity Trap Concept
We’ve written extensively on this topic in another post, but we thought it worth mentioning here that some short squeezes don’t take as long to “build”. There are times when low float stocks ramp up on huge volume, sell off, then squeeze right back up in a matter of days.
Take a look at these few examples and see if you can piece together the liquidity trap and sudden increase in days to cover — without actually having seen any days to cover fundamental data.
WHLM liquidity trap in 3-4 days
KPLT liquidity trap
Hopefully you can see the concept. A great way to search for these is to scan for stocks that gap up on heavy volume and low float. Keep them on watch in the days after to see if volume recedes, then picks up again.
Other Ways to Find Stocks Ready to Pop
Short squeezes are difficult to identify by simply looking at a stock chart.
You can always analyze the short interest of a stock and the days to cover; however, you will never be sure when a short squeeze will occur.
For this reason, you can look to technical indicators to confirm potential short squeezes.
Oversold (Overbought) Indicators
Identifying technical indicators with reliable oversold readings is the most useful tool for identifying short squeezes. Oscillators are a great type of leading indicator as they provide oversold readings right before the positive price action.
Some indicators which provide oversold readings are:
Stochastic Oscillator
Relative Strength Index (RSI)
Commodity Channel Index (CCI)
Rate of Change (RoC)
Short Squeeze Trading with the Stochastic Oscillator
The stochastic oscillator consists of two lines which are floating in and out of an upper, mid, and lower area.
When the two lines enter the oversold area, we have a potential buy signal. A long trade can be opened when the two stochastic lines cross and exit the oversold area.
Since we are trading a short squeeze, we need to attain oversold signals from the stochastic. Let’s see how the stochastic could have been applied in these two short term squeeze examples:
Short Squeeze and Stochastics
Notice that during the period when the short interest was increasing, the stochastic lines cross downwards and exited the overbought area.
After entering an oversold condition, the two lines began to trend upwards.
Three days later, we get a bullish explosion of 16.4% for one day and a further expansion to 20%.
Let’s now apply the stochastic to the other example:
Short Squeeze and Stochastics 2
Again, we have the stochastic oscillator at the bottom of the chart.
While the short interest was increasing, the stochastic lines were also decreasing.
Then the two lines entered the oversold area. After tracking the price action for a few days, once the lines exited the oversold area, we bought MN.
Two days later a short squeeze ensued. MN experienced a strong bullish move where the price increasing 21% in two days.
Short Squeeze Trade Management
Trying to time a short squeeze will be one of the most challenging jobs you find in the market.
The reality is that stocks often have a high short interest because they are crappy companies and the stock price is likely to go lower before making a run.
Think about it, you are in essence trying to catch a falling knife in the hopes of catching the pop.
As we have said many times, in equity trading, you will never be right 100% of the time. We have also shown you profitable trading strategies with only 20% success rate. Short squeeze trading should really be no different than your normal trading. There needs to be a setup there technically, despite the underlying days to cover and short interest fundamentals.
Short squeeze trading can be profitable as the moves are so violent to the upside and there is no limit on how far the stock can run.
Stop Loss
The one good thing about trading short squeezes is that you can keep tight stops.
When you enter a trade on a potential short squeeze, you should put your stop below an area of support. Always keep in mind your risk to reward when setting a stop.
Target
This is the tricky part.
Your targets on short squeezed stocks will be somewhat extended. Did you notice that in the two examples above we had a 20% price increase for both? Not to mention that AMC and SPRT more than tripled!
In most of cases a successful short squeeze will lead to a price increase above 15% on small cap stocks, minimum.
However, what are we going to use as a signal in order to exit the market?
The stochastic oscillator will do the heavy lifting when determining your exit.
Simply stay in your long trades until the stochastic enters the overbought area. Do not wait for a line crossover in a bearish direction. Just wait for the lines to enter the upper area and to close one period.
Otherwise, hold for potential climactic action on the daily chart.
Doing the Math
Let’s say you invest $1,000 in each of your short squeeze trades. At the same time, your system has only a 10% success rate. You risk 0.5% in each of your trades. We will take a minimum target of 10% for our trades.
Below is a breakdown of the math:
$1,000 x 0.5% = $5 (loss)
$1,000 x 0.5% = $5 (loss)
$1,000 x 0.5% = $5 (loss)
$1,000 x 0.5% = $5 (loss)
$1,000 x 0.5% = $5 (loss)
$1,000 x 0.5% = $5 (loss)
$1,000 x 0.5% = $5 (loss)
$1,000 x 0.5% = $5 (loss)
$1,000 x 0.5% = $5 (loss)
= 9 x 5 = $45 loss from 9 trades in a row.
$1,000 x 10% = $100 (profit)
So, with 10% success rate and a relatively low target of 15%, we are likely to generate:
100 – 45 = $55 profit per 10 trades.
Please note you have to be ok losing 9 trades in row.
End to End View of a Short Squeeze Trading Strategy
Let’s now wrap up all rules of the short squeeze trading strategy in one example:
Short Squeeze Trading Example
This is the daily chart of Era Group. The image shows a short squeeze scenario.
Era Group is in a selloff leading into the end of February. At the same time, the Nasdaq is reporting 6 days to cover.
The green circle on the chart shows the long signal we receive from the stochastics.
We immediately enter a long trade at $6.97 per share and we place a stop a bit below this point, since it is the lowest on the chart. Our stop is at $6.94 per share which is 0.43% below the entry price.
The price starts increasing rapidly right from the moment we entered the market.
The first candle during our log trade is huge. At the same time, the stochastic is increasing as well. Three periods (days) after we entered our trade, both stochastic lines cross into the overbought area. This is our closing signal and we exit our trade.
We were able to catch a 51% increase on this trade – unbelievable!
So, investing $1,000 in this trade we would have generated profit equal to $501, while risking $4.3. The trade lasted for three days. The risk to return ratio of this trade is huge!
Please remember, these cases are extremely rare!
Conclusion
The days to cover is a ratio which displays how many days short sellers need to cover their positions.
Days to cover is calculated by dividing the current short interest / average daily volume.
Days to cover helps determine if a stock is a likely short squeeze candidate.
We have a short squeeze when short sellers cover their trades and create extra buying pressure.
Short squeezes can lead to huge price jumps.
An oscillator could be helpful when looking for short squeezes.
When you trade short squeezes you will usually have 10% – 20% success rate.
When you trade short squeezes, you can aim for increases around 15%.
You will usually risk about 0.5% of your investment per trade.
Sometimes, anomalies could occur, where the price increases significantly as illustrated above; however, these cases are extremely rare.
Averaging down is the popular way to describe buying more of a position as a stock goes down. It’s akin to seeing something you think is valuable in a supermarket getting marked down over and over again. And because you believe it is undervalued, you buy more of it as the price plummets.
But is the averaging down trading strategy profitable over the long-term? How about when day trading? What are the pitfalls?
In this post, we will cover the basics of the averaging down trading strategy and why this approach can be dangerous for your portfolio. We’ll also look at why “averaging up” on a short position can be even more dangerous. Lastly, we’ll give an example of when averaging down might work.
What is Averaging Down?
Averaging down is the process of adding to a position as it goes counter to your initial transaction. You can also “average up” in a position when you are trying to short it. In other words, you sell more shares short as the price rises — moving your average price up as you go.
In theory, this makes sense because it will allow you to obtain the same asset at a better price. Therefore, you can average down or up on the entry price and, in turn, increase the profits when you close out the position.
That being said, there is one major flaw in this strategy. You have no clue which trades will go in your favor and which will continue to slide against you.
A Competing Theory
Opponents of this strategy point to the old adage of cutting your losers and letting your winners run. This sounds easy enough, but why is this so hard to do?
The answer to that question is rooted in the fundamental human nature to hope. Just like other parts of our ordinary lives, we tend to want to hang on to things too long, hoping they’ll change for the better.
For this reason, when we see a stock is no longer going in our favor, instead of taking the loss, we do what we think is the “smart” thing and add to the position. It’s all based upon our ego and not wanting to be wrong.
Yet while change may inevitably come, all too often that hope may take us on a ride far longer and more costly than we ever imagined.
If you can accept a loss for what it is, then trading becomes one of the most straightforward business operations you could ever undertake. But instead of treating our trades like a business decision, we get stuck in the emotional attachment of holding on.
Investors use phrases like averaging down to justify their risky actions of not only holding onto a losing position but adding to them.
To understand the psychology of it all, let’s step back from the trading game for a second and look at the concept another way.
Would You Average Down with any Other Business?
To simplify the concept of averaging down, let’s say you owned a small housewares shop. In this shop, you sell all types of products.
But you recently added a new style of toaster that is going to change how people eat their breakfast.
Placing the toaster in your front window with banners and ribbons, you think the toasters will fly off the shelf. You believe in the product.
However, to your surprise, you were only able to sell one toaster in an entire week.
You look over your inventory sheet, and you realize that you have 499 toasters left to sell, so you begin to worry a little and place a phone call to the supplier.
Somehow Things Get Worse
The supplier empathizes with your concerns.
To help you out, they offer an additional 20% discount to improve your margins. This time, you know that things will be better because you can average down on the price you paid for the toaster.
Perhaps the only reason the toaster is not selling is due to the sale price.
With that in mind, you take the supplier up on their offer. You now own 1,000 toasters. 2/3 of your inventory are priced at the discounted rate — a better average price.
You mark the price down slightly, but to your surprise, there is no additional interest. You are still unable to sell any toasters.
What would you do at this point? Would you average down again?
Take a look at what this activity would look like on a stock chart. Imagine if these shares of Citigroup were toasters:
As you can see, trading is just like any other business. So, why expose your trading account to this risky behavior?
2008 Mortgage Crisis – Example of Averaging Down
For those of you that can remember the bear market in 2008, it was nothing short of brutal. The market fell off a cliff and just kept going.
As an investor, you may have decided to buy the Dow Jones as it was tanking. This is what it would have looked like:
As we all know, the Dow is now trading back over 30,000. However, it has taken 13 years to get there. Why not let others clamor for the bottom in pricing, while you pick up the pieces once they’re exhausted?
Only Average Down from a Position of Strength
This may sound a bit contradictory at first? Let’s explain.
A position of strength means you are buying into the dips of a strong trend.
You can get a better feel for the concept through chart illustrations. Let’s examine a few.
Comparing the two charts below, which stock would you want to average down on?
Strong UptrendWeak Uptrend
You are probably thinking, well you can’t average down in the first one because it’s at highs and showing real strength.
Well, that’s precisely what we want to see.
You just need to go to a lower time frame, like 5 minutes for example, to find an opportunity where you can average down in the stock. The $23 level was finding support on the daily chart, so we zoom into the 5min chart and place our “dip buys” there.
Average Down on 5 Minute Chart
Remember, this stock was at multi-month highs on a daily chart. So, buying into this stock would be buying right as it is breaking out on an intraday and daily basis.
We call these constructive pullbacks. They are different from reversals and capitulations. Ideally, they occur in a young, strong uptrend, where we expect more highs.
This is how you buy from a position of strength.
To reiterate: averaging down can be very risky. But, if you are going to do it, you have to buy into a stock that is trending strongly.
Closing Trades You’ve Averaged Into
There are two choices you have when deciding how to close out your trades. Please review each approach in detail and think back to your trades to see which one will work best for you.
Close Out the Position in Pieces
If you fid yourself in the position of having averaged down on a trade, it may make sense to close the position out in pieces.
For example, if you had four buys into a falling stock, you would have the same four sells to exit the trade.
Now, this is where it gets a bit tricky.
If you are up on the position and you want to scale out as things go in your favor, this makes total sense. You are never going to go broke taking money out of the market as things go your way.
Scaling Out
In the above chart example, you can see three entries and three sells. This scenario would be the best you can hope for with this approach.
Averaging down would have allowed you to gain a better average share price, while you are then later able to scale out of the position at much higher prices.
Again, this is assuming the entries were from a constructive overall pullback.
Two Things Required to Close Out in Pieces
There are two pieces to this puzzle you need in your favor.
Firstly, as you average down, you need the stock to hold up and not continue lower. In other words, a constructive pullback into an area of support like we mentioned earlier.
Secondly, the rally not only turns a profit for you but rallies strongly enough that you can sell out in equal pieces.
This even more challenging of a concept when you factor in day trading, as the morning high set within the first hour of trading is often the high for the entire day.
Again, this can be a risky trade if the stock doesn’t bounce. Imagine the example below:
ALF average down
In this event, how do you scale out of a losing position? Assuming you didn’t sell at the bottom.
This is where paralysis could set in and as stated earlier, you now take a massive loss as you are carrying a large position after averaging down and you are completely vulnerable.
Close Entire Position
If you are closing your entire position, you are doing so for one of two reasons: (1) you have hit your target price or (2) you are getting crushed, and your stop loss was triggered.
Hit Your Target Price
Buying from a position of strength means being in a stock that is going in your favor soon after your entry. This is ideal.
As we mentioned earlier, this typically occurs in a strong uptrend, or right after a constructive pause in that trend.
Nice and Easy
In these slow and steady stocks, it is easier to sit tight until your target is reached.
The benefit of holding your entire position until you reach your target is reaping all the profits at the highest price. The downside is you are completely exposed until your goal is reached.
Stop Loss Exit
This one typically hurts the most for amateur traders. But for experienced traders, it doesn’t hurt as badly.
Why?
Disciplined traders only put on trades when all their criteria are met. This doesn’t mean they have a 100% chance of success in the trade. It just means they have a high probability of success.
So when their stop losses are hit. They don’t take it personally. They chalk it up to the 15% of trades they know they’ll lose.
On the other hand, the amateur trader is averaging down during this process. And depending on how you averaged down will determine how much pain you are feeling as the stock goes against you.
However, like the professional trader, if you have a set amount you use on every trade and you scale in, then while you will take a loss, it may still be manageable.
Now, if you use a set amount per trade, but have gone beyond your standard per trade amount and have doubled or tripled your exposure when averaging down – you are in trouble.
Regardless of the amount of pain due to the loss, closing out the position at your predetermined stop is the right decision.
In Summary
Ultimately, averaging down or up is your decision as a trader. As we have recommended, if you are going to average down, do it from a position of strength.
Better yet, we encourage you to track your results over a minimum of 20 trades or more in a simulated environment.
See if averaging down has helped improve your bottom line before you put real money to risk.
Good luck!
As day traders, the biggest dilemma we will ever face is our own errors. That is, knowing what not to do, and yet still doing it. Lack of discipline, if you will. Therein lies the importance of finding the backside of a trade before going short.
Here’s Why
Most newer traders are impatient. A lot like babies, really. You want what you want, when you want it, and you want it right now! Profits galore! This trade to work!
And when it doesn’t work, frustration sets in. Then doubt. Then fear. And you finally hit rock bottom. No wonder so few make it in this industry.
Meanwhile, veteran traders smile and they smile — because they’ve been there. They know the pain of averaging up, and up, and up, only to be stopped out of a trade the moment it turns. Don’t take our word for it, listen to Professional Trader Nate Michaud’s own advice when you have time.
Guys like Nate are veteran traders for a reason. They learned long ago to stop beating their heads against the same old stubborn walls, thankfully before they went broke.
With discipline as our backdrop, we are setting the tone for the importance of understanding the backside of a short trade. As with any trade, you want to have a plan, a thesis, confirmation of that thesis, and all the necessary components to line up before you risk your hard-earned capital.
The Risk
Jumping in too early can mean the difference between a profitable day, or a losing month. Heck, it can be the difference between a profitable day, or no longer being able to trade because you’ve blown up your account.
Shorting is risky because your reward is limited but your risk can be limitless. Unlike going long, where your risk is limited, and your reward is limitless.
If that doesn’t make sense, imagine shorting a stock with 100% of your capital at $5. If that stock goes to $10, $20 or more, you’ve lost more than your account had to begin with. That’s when brokers liquidate your positions and call wanting their money back.
Don’t think this can happen? Think again. It only takes one black swan event to change your life for better or worse. Don’t take our word for it, listen to this sobering reminder from Alex Salfetnikov in our podcast interview with him.
SPI on September 23, 2020 going from $1 to over $40 in one day.
Now, that definitely looks scary, doesn’t it. But the great thing is, when shorting is done properly, it can lead to solid gains in the market. After all, stocks don’t always go up. So, why not capitalize on the opportunities when they fall?
In order to do so, it is imperative that you know what to look for and when to time the entry correctly.
Let’s look at a few high level explanations of what to look for, then we’ll dig in deeper with more examples later.
What is NOT the Backside
Frontside vs. Backside
Let’s get visual, shall we?
At a minimum, a stock has not entered the back side of a bullish run until it is no longer putting in higher highs and higher lows on at least a 1, 2, 3, or 5 minute chart.
Notice the new highs that are circled and the higher lows that are boxed in this CAN example below:
CAN Frontside Higher Highs and Higher Lows
This doesn’t mean that if you employ a scalping strategy, you can’t take a small short from the new highs back to the new lows — granted you are skillful with such a tactic.
Nonetheless, if you step back and view the big picture, it becomes clear that we are on the front side of the bigger move.
What IS the Backside?
Depending on the the type of reversal you’re studying, this can vary to some degree. But, for all intents and purposes, a stock is not on the backside of an intraday run until it has either exhausted its upward momentum in such a way that it cannot move higher, or it begins to put in lower highs and lower lows.
Or both…
CAN Backside of Trade
On the back side of this CAN example, we notice the boxed lower highs and the circled lower lows.
Of course, the question is “when can you enter and anticipate these lower lows?”
There are many different ways to indicate this, but we’ve picked 8 of the more common and simpler methods.
8 Criteria for Confirming the Backside Short
1. Climactic Volume and Price Action (Exhaustion Volume)
Sticking with our CAN example above, let’s go back and analyze the price and volume action.
CAN Frontside price action analysis
Notice two things on this chart: Effort (volume) and Result (Price). That’s really what we want to pay attention to when it comes to analyzing Volume and Price Action trading.
Using the callouts on the chart, what can we glean?
As effort increases to push the stock higher, we begin to see upper wicks on the candles at those new highs (circled). Thus we can assume supply is entering the market here.
For each new push to the highs, we see diminishing result (a correction on lower volume).
What this tells us is that there is distribution going into the upward movement, despite some re-accumulation or short covering occurring at the lows. Overall, this could lead the price increase to eventually stall.
2. Multiple Time Frame Extension
In order to qualify the overextended character of the stock in play, we ought to check other time frames as well. The above examples were taken with a 2 minute chart. For this example, lets examine the 5-minute chart:
CAN 5-minute parabolic candles
As a good rule of thumb, for a stock to be considered “parabolic” you want to see at least 3 large marubozu candles (like you see in the Three White Soldiers pattern) in a row, speeding to new highs on heavy volume.
Judging from the chart above, we have just that.
Not only does the stock go parabolic here, but it reaches the upper bounds of its regression channel for that morning — a good indicator of a potential reversal.
CAN 5 minute chart regression channel
Now we have at least a few criteria met as we begin to anticipate the reversal: overbought conditions with supply increasing on heavy volume; parabolic on multiple time frames; and hitting our regression lines.
3. Waves and Diminishing Force
Without getting too detailed on “wave theory” or indicators and such, suffice it to say that most market moves occur in waves. It is something that anyone with just a quick glance can see on a chart.
CAN 5 impulse waves
Here on the front side of CAN, we see 3 mature waves higher culminating in the “V” at the top and 2 consolidation waves that follow. As traders, it isn’t necessary to draw the lines, or even count the number of waves.
You can do that if you want, but the goal here is to mentally anticipate the “late innings” of the bull run. Being aware of the number of waves up, and the force with which those waves are moving can tell us a lot about where the stock may be going next. Especially if we spot exhaustion.
Bulls can’t run forever.
In the example with CAN, it indicates we are due for a pause at the very least.
4. Daily/Weekly Resistance Levels
Resistance levels on higher time frames can be super important when timing your entries. It doesn’t necessarily mean that these levels will work 100% of the time, but when you have multiple criteria lining up, these key levels become an important part of the recipe.
As we zoom out here on CAN to look at the 1 hour and daily charts, notice the arrows we have drawn around the rectangular “support/resistance” zone.
CAN daily and 1-hour resistance levels.
Looking left on the chart, we notice that prior support areas from over a month ago (indicated by the blue arrows) have now become resistance areas during recent trading sessions (more blue arrows).
In fact, this level lines up with the very top of our intraday chart:
CAN resistance levels on the daily representing the back side of the trade.
As we are building our thesis for the short trade we want to take, this rejection of a key daily price level only adds to our confidence.
Levels like this can lead to really big gains when trading small cap stocks using the VWAP Boulevard strategy. If you haven’t read about it, be sure to check out our Ultimate Guide when you have more time.
5. Candlestick Pattern Reversal
Now we are getting into the nitty gritty of the of the price action. Candlestick Patterns are extremely useful for “reading” the psychology of the trade.
It is the candlestick patterns that tell us the story behind the action between bulls and bears.
Bearish engulfing two-minute candle pattern
On the 5 – minute chart we showed earlier, we saw three extremely climactic bars. When we spot that, we want to narrow our focus to see if we can find any other confirmation candles on lower time frames.
Here on the 2 – minute chart we see a bearish engulfing candle pattern. This occurs when a bearish candle completely engulfs a bullish candle next to it.
In fact, on just about any lower time frame, the 1 minute, 2 minute, 3 minute, or 5 minute, you’ll like find one of the above candle patterns to confirm the reversal.
Why is this important? Is this the backside confirmation?
No. It is just one of many confirmations.
However, as this article is covering the question of “how to find the backside,” it if the speculative trader wants to find an “early entry,” this would be the spot.
With diminishing force, three-waves up, daily resistance, and now a bearish reversal candlestick pattern, you could enter the trade on the close of the engulfing candle and risk against the high of the day.
6. MACD Cross
For the MACD indicator, what we want to look for is an extension, a divergence, and a cross.
On the 5 minute chart of CAN, we get all three.
CAN MACD indicating backside
Pay attention first to the light blue line drawn from the top of the first MACD extension down to the second. What this tells us is that we have a divergence with the price of the stock and the force of the trend.
As the force of the trend is putting in a lower high, the price was putting in a higher high. This gives us pause for concern that any further price advances can happen.
In addition, we get a “convergence,” or cross, shortly after CAN puts in a top at the daily resistance levels. The short period (12) moving average crosses the 26 period — a bearish cross.
Both of these act as confirmation that we are topping.
7. Moving Average Cross
In addition to the MACD, moving averages can be a fantastic “change of trend” indicator.
The more popular intermediate moving averages for determining trends are the 20-period and the 50-period. Using these two, let’s impose them on the CAN chart and see where the trend changes.
CAN backside moving average confirmation for short trade
In this 2 minute chart, notice how CAN is riding the blue 20ema for the entirety of the move. Likewise, the red 50sma is trending below the 20.
It isn’t until the top is formed and we have put in a lower low and lower high that we see a bearish cross of the two moving averages. This is the confirmation we need for the reversal.
If you want to try to time the reversal a bit early you might try a 1 minute chart. Just keep in mind that you will find more “noise” and false signals on lower time frames because of the volatility.
CAN backside short confirmation
As you can see, the 1-minute chart crosses at least once before reaching the top. But if you can combine these lower time frames with each other, it can lead to better pilot entries in anticipation of more confirmation.
Or, you can wait for the higher time frames to form a bearish cross. Many times a stock will bounce back into those resistance levels offering a chance to enter on the brief rallies.
8. Lower Highs, Lower Lows
The last bit of confirmation is quite obvious. Like we mentioned at the beginning. With all the above criteria lining up for your trade. You want to see the stock begin to put in lower lows and lower highs.
Lower highs and lower lows on the CAN backside short
Just as we had on the front side of the move, we now have a trend forming on the back side. A good trend will often mind the bounds of a channel, and CAN is no exception here.
We ride the new trend down until it changes on us.
And that is the anatomy of the backside of a short trade. The more “criteria boxes” you can check off, the more successful the trade will likely be.
As with any entry in a security, you want your thesis and trade plan to be supported by evidence. After that, it is a matter of mitigating risk by setting a stop loss if the plan goes awry.
The rest is just trade management. Follow the trend until it changes again!
Other Considerations When Going Short
Market Environment
As with any trade, it is always a good to check what the general market is doing. Are the indexes bullish? bearish? trending sideways?
When you watch for the indexes or other industry names associated with the stock you are trading, you can be more aware of shifting sentiment.
As an example, let’s pull up a few other stocks similar to CAN and see how they were performing on this day.
CAN compared to FTFT, BTBT, RIOT
See any similarities?
Clearly, there were more stocks running in the “blockchain” industry that day. This is what we mean by keeping track of broader-related sentiment, industries, and indexes.
One stock’s movement can often signal a change in the others.
Liquidity
As with any stock, you want to make sure there are enough shares being traded so that you can get in and out with the size you want. As a rule of thumb we don’t recommend trading stocks with liquidity below a million shares traded on the day.
Not only will they move more slowly, but your fill prices will likely be affected negatively.
Float
Keep an eye the float of the stock that you are trading. The lower the float, the more volatile — as a general rule.
Imagine a stock with only 5 million shares available to trade. If those shares are being churned through every 15 minutes, you can imagine that the price will fluctuate considerably.
Compare this to a stock like AAPL, which has billions of shares available to trade. Obviously, AAPL will move much slower.
Time of Day
We talk about this in a great post explaining a strategy called VWAP Boulevard. In that post, we outline how the strategy is “time-centric”.
In other words, if volume is not exponentially climactic before 10am and then drastically diminished afterward, the pattern could be broken. Our trading expert Aiman Almansoori also talks about this in his Reversal Webinar on our YouTube, so be sure to check that out.
While shorts can setup any time of day, there are a few generally accepted “best times” to trade. Those are considered the “reversal hour” around 10:30 – 11am and the 2-3pm “profit taking” time.
As always, backtest your strategy in a simulator to find the best times.
Availability of Shares
Not all securities will be available to your broker for shorting. We call these issues “hard to borrow” stocks. Often, you’ll have to locate shares to trade with your broker and this may cost a fee.
Ultimately, we want to ride the downward momentum of the stock until the character and trend changes.
Backside Indicators for Download
As of the time of publication, there is one known “backside indicator” that has been coded by scripstotrade.com in an effort to make “spotting the backside” easier.
We have not used the indicator, so be sure to test it out before using real capital.
How to Practice Finding the Backside
It has always been our goal here at TradingSim to build the most realistic learning environment for trading the stock market without real capital.
With over 3-years of tick-by-tick data, you can find more intraday examples to learn the “backside” of a trade than you actually have time for.
And that should be your goal.
Use our built-in scanners to scan for stocks that are going parabolic intraday. Watch them, identify your criteria as outlined above, and make the trades.
Analyze a set of at least 20 trades and determine your profitability. Once you see a winning success rate, take it live.
Trading without candlestick patterns is a lot like flying in the night with no visibility. Sure, it is doable, but it requires special training and expertise. To that end, we’ll be covering the fundamentals of candlestick charting in this tutorial. More importantly, we will discuss their significance and reveal 5 real examples of reliable candlestick patterns. Along the way, we’ll offer tips for how to practice this time-honored method of price analysis.
After all, there are traders who trade simply with squiggly lines on a chart. Astonishingly, some don’t even look at the charts! Instead, they pay attention to the “tape” — the bids and offers flashing across their Level II trading montage like numbers in The Matrix.
No doubt, there are countless ways to make money in the stock market. In fact, there is no right or wrong way to read a chart. But unless you are just a gambler, you need some form of data to make informed decisions.
We believe the best way to do this is by understanding candlestick patterns.
For newer traders, even reading candlestick charts can seem like an insurmountable learning curve. There appears no rhyme or reason, and no end to the amount of price and volume data being thrown your way.
It’s daunting, for sure. Especially when you’re just getting started.
But be of good cheer! There is a method to the madness. The method is in the patterns. The patterns reveal probabilities. And the right probabilities create opportunities.
More importantly, the right opportunities can create profits.
This is where candlestick patterns come in handy. They help us to decipher the patterns of the market. They’re like little road signs on crowded streets. And with enough repetition, enough practice, you just might find yourself a decent chart reader.
That’s why you’re here, right? To learn to navigate the murky waters of the market?
According to Investopedia.com, it is commonly believed that candlestick charts were invented by a Japanese rice futures trader from the 18th century. His name was Munehisa Honma.[efn_note]Farley, A. (2021, April 29). The 5 Most Powerful Candlestick Patterns. Investopedia.Com. https://www.investopedia.com/articles/active-trading/092315/5-most-powerful-candlestick-patterns.asp.[/efn_note]
Honma traded on the Dojima Rice Exchange of Osaka, considered to be the first formal futures exchange in history.[efn_note]NinjaTrader. (2019, April 17). Candlestick Charting: Legend of Munehisa Homma. NinjaTrader.Com. https://ninjatrader.com/blog/candlestick-charting-legend-of-munehisa-homma/.[/efn_note]
As the father of candlestick charting, Honma recognized the impact of human emotion on markets. Thus, he devised a system of charting that gave him an edge in understanding the ebb and flow of these emotions and their effect on rice future prices.
Honma actually wrote a trading psychology book around 1755 claiming that emotions impacted rice prices considerably.[efn_note]Beyond Candlesticks: New Japanese Charting Techniques Revealed, Steve Nison , Wiley Finance, 1994, ISBN0-471-00720-X.[/efn_note]
When all are bearish, there is cause for prices to rise.
Munehisa Honma[efn_note]Beyond Candlesticks: New Japanese Charting Techniques Revealed, Steve Nison , Wiley Finance, 1994, ISBN 0-471-00720-X, p14.[/efn_note]
In recent history, Steve Nison is widely considered the foremost expert on Japanese candlestick methods. After all, he wrote the book that catapulted candlestick charting to the forefront of modern market trading systems.
Beyond Candlesticks: New Japanese Charting Techniques Revealed, is one of his most popular books and a definitive resource for candle patterns.
Since the 90s, this method of charting has become pervasive throughout all financial markets: equities, futures, forex, and more.
In his books, Nison describes the depth of information found in a single candle, not to mention a string of candles that form patterns. It truly puts the edge in favor of a skilled chartist.
The Story That Candlesticks Tell
Emotions and psychology were paramount to trading in the 1700s, just as they are today. This is the foundation of why candlesticks are significant to chart readers.
How so?
Every candle reveals a battle of emotions between buyers and sellers.
As the great trading psychologist Brett Steenbarger notes, “proper training is the best source of discipline and the most effective safeguard against intrusive anxiety and impulsivity.”
With this in mind, understanding the emotional story within candlesticks is a great place to start that training.
How are Candlesticks Formed?
There are three types of candlestick interpretations: bullish, bearish, and indecisive. This is painting a broad stroke, because the context of the candle formation is what really matters. But for all intents and purposes, we’ll stick with these three categories.
The elements of a candlestick
What Is a Candlestick?
The formation of the candle is essentially a plot of price over a period of time. For this reason, a one minute candle is a plot of the price fluctuation during a single minute of the trading day. The actual candle is just a visual record of that price action and all of the trading executions that occurred in one minute.
Similarly, a daily or weekly candle is the culmination of all the trading executions achieved during that day or that week.
The open tells us where the stock price opens at the beginning of the minute. The close reveals the last recorded price of that minute. The wicks (also known as shadows or tails) represent the highest and lowest recorded price from the open and close.
According to Nison, the Japanese placed much less emphasis on the highs and lows of individual candles. For them, as it is for modern technicians, the opening and closing prices were more relevant.[efn_note]Beyond Candlesticks: New Japanese Charting Techniques Revealed, Steve Nison , Wiley Finance, 1994.[/efn_note]
Essentially, the broader context of candles will paint the whole picture.
What Is a Bullish Candle?
A bullish candle is formed when the price at the closing of the candle is higher than the open. This can be on any time frame: from a 1-minute candle to a 1-month candle. It will all be the same.
A bullish candle opens low and closes high.
Typically these candles close with a green or white body color, though most charting platforms allow for customization these days.
What Is a Bearish Candle?
Conversely, a bearish candle is assumed when the closing price is lower than the opening price. In other words, the price dropped in the amount of time it took for the candle to form.
A bearish candle opens high and closes low.
By default, most platforms will show a red or black candle as bearish.
What Does the Candle Formation Tell Us?
This is the real question we need to ask ourselves. It isn’t enough to know that the candle opened and then closed lower, or vice-versa.
As renowned trader and best-selling author Dr. Alexander Elder explains, “The main advantage of a candlestick chart is its focus on the struggle between amateurs who control openings and professionals who control closings.”[efn_note]Elder, A. (2014). The New Trading for a Living: Psychology, Discipline, Trading Tools and Systems, Risk Control, Trade Management (Wiley Trading) (1st ed.). Wiley.[/efn_note]
Dr. Elder may be referring to daily candles, but his point is still important. The candle represents a struggle between buyers and sellers, bulls and bears, weak hands and strong hands.
Armed with that knowledge, let’s dig in and see what picture those little candles are trying to paint for us.
The High of the Candle
The high of each candle, whether it is the tip of the wick at the top, or if the body closes at the top, represents the maximum effort of bulls. If it is a daily candle, buyers could not push the price of the stock one cent more during that day.
Why is that important? There are two reasons:
This could represent a near term level of resistance which will have to be broken for the price to move higher.
In order to find enough demand to push through that resistance, the stock may need to consolidate lower until enough shares are accumulated.
The Low of the Candle
Just as the high represents the power of the bulls, the low represents the power of the bears. The lowest price in the candle is the limit of how strong the bears were during that session.
Why is this important? Again, two reasons:
This could represent a near term level of support where bulls were able to stop the downward momentum
To move lower, more supply may need to enter the market at higher prices.
The Closing Price of Each Bar
This is where the story gets interesting.
When a candle closes above its opening price, we can assume that the bears won in some form or fashion. How much it closes above the open tells us with what intensity the bulls were in control during that session.
Let’s look at few examples to better understand this:
In this chart, we see the “Three White Soldiers,” which is a candlestick pattern describing three bullish candlesticks in a row. What can we interpret from this?
Three White Soldiers candlestick pattern
It is clear to see that the candles open low and close high. Bulls were clearly in control during each session with very little energy from the bears.
Now contrast that with what we see in the next example. Ask yourself, who was in control during this session?
Apparently there is indecision as to who is in control. How do we know? Think about the story behind this “Spinning Top” candle:
The stock opens, proceeds lower as bears are in control from the open, then rips higher during the session. But after putting in a decent high, the bulls settle back and give the bears some control into the close.
Are you beginning to see how the story unfolds?
These are the stories that candles tell us on charts. Who is in control (greed), who is weak (fear), to what extent they are in control, and what areas of support and resistance are forming.
The Range between the Open and Closing Price
This is one of the most important aspects of interpreting candles. As Dr. Elder notes, the range between open and close “reflects the intensity of conflict between bulls and bears.” [efn_note]Elder, A. (2014). The New Trading for a Living: Psychology, Discipline, Trading Tools and Systems, Risk Control, Trade Management (Wiley Trading) (1st ed.). Wiley. p 53.[/efn_note]
In day trading, momentum is everything. On this token, the character of the candles can tell us if there is demand or if a stock is sleepy and uninteresting — whether we are about to launch, fall off a cliff, or just grind sideways.
Additionally, the nature of the candles can tell us when to enter with tight risk. Or, when to take profits into climactic candles.
In the end, it all boils down to context and the story of buyers and sellers behind the tape.
5 Real Examples of Reliable Candle Patterns
Without practice, none of this information really matters. It takes screen time and review to interpret chart candles properly. There are no free lunches in the markets.
With that being said, let’s look at some examples of how candlestick patterns can help us anticipate reversals, continuations, and indecision in the market.
1. The Hammer / Hanging Man
The Hanging Man is a candlestick that is most effective after an extended rally in stock prices. The story behind this candle tells us that there were extensive sellers in the formation of the candle, signified by the long wick.
It is usually accompanied by heavy volume.
The Hanging Man appears at the top of an extended uptrend before reversing.
The Hammer is another reversal pattern that is identical to the The Hanging Man. The only difference is the context. The Hammer occurs at the end of a selloff, signifying demand or short covering, driving the price of the stock higher after a significant selloff.
Like the Hanging Man, you want to see a solid volume signature associated with these candles.
Hammer candles appear at the bottom of a downtrend before a reversal
2. Engulfing Patterns
Engulfing patterns offer a great opportunity to go long while keeping risk defined to a minimum. As you can see in the example below, the prior bearish candle is completely “engulfed” by the demand on the next candle.
A bullish engulfing candle at the market open.
Another example of engulfing patterns is the Bearish Engulfing Sandwich. Here we have what appears to be a bearish reversal, but the next candle completely swallows the supply from that red candle:
A bearish engulfing sandwich pattern, also know as a stick sandwich
3. The Morning Star
The Morning Star is yet another reversal signal. It can be found at the end of an extended downtrend or during the open. It takes 3 candles to confirm the setup.
The first candle must be a strong downtrending candle.
The second candle is the star. It’s usually a narrow body candle that, ideally, does not touch the body of the prior candle.
The third candle is a strong bullish candle confirming the new uptrend.
The morning star candlestick pattern at the open
4. The Evening Star
Similar to the Morning Star, the Evening Star is its bearish cousin. It forms at the top of parabolic or extended bullish runs. Much like the Morning Star, the body of the candles should not touch.
Here are three criteria for spotting the shooting star:
The bodies do not overlap
The third candle is a strong bearish candle closing into the body of the first candle
Volume should increase from left to right in the pattern
The Evening Star candlestick pattern on GME
As with all of these formations, the goal is to provide an entry point to go long or short with a definable risk. In the example above, the proper entry would be below the body of the shooting star, with a stop at the high.
5. Indecision Candles
The doji and spinning top candles are typically found in a sideways consolidation patterns where price and trend are still trying to be discovered.
Indecision candlestick patterns
The “doji’s pattern conveys a struggle between buyers and sellers that results in no net gain for either side,” as noted in this great article by IG.com.
Will it continue upward? Go sideways? Or reverse?
With indecision candles, we typically need much more context to answer these questions.
Gravestone Doji candles can represent indecision on a chart.
Note the trend is mostly sideways in this first circled example. For this reason, waiting for the reaction to these candles is usually best for risk management.
Eventually, the price falls in this particular case as the trend becomes more extended into the rally. Correspondingly, the Shooting Star that occurs just beyond the Gravestone Doji is confirmation of that falling price action.
The Best Way to Practice with Candlestick Patterns
As always, it is best to practice a strategy before putting money to work in the market. There is no better way to do this than with a simulator.
One of the best methods to train your “chart eye” to see these patterns is to simply replay the market, noting each time you see a particular candle.
Everybody wants to be a successful trader. While there are many strategies to become a successful trader, there are 10 pivotal ways that traders can have to build a winning portfolio. This TradingSim article will give traders the top 10 strategies on how to develop a solid trading strategy, highlight 5 specific investing strategies, and will assist investors who want to choose the best stocks or other investment instruments.
Why do investors need a trading strategy?
Investors need a trading strategy to avoid emotional investments. Trading strategies are necessary to avoid irrational actions during extreme swings in the stock market. It’s especially important to have a framework for trading during a bear market. Legendary investor Warren Buffett noted that investors have to remain calm to pick the best trading plan.
“Owners of stocks, however, too often let the capricious and often irrational behavior of their fellow owners cause them to behave irrationally as well, ” said Buffett.
Buffett added that an emotionless trading strategy is crucial.
” You need a stable personality. You need a temperament that neither derives great pleasure from being with the crowd or against the crowd because this is not a business where you take polls. It’s a business where you think,” added Buffett.
Having a trading strategy with predetermined rules that help investors make decisions help investors make the best choices. Here are 10 steps that will help formulate an effective trading plan.
1. Determine a trading goal.
When formulating an investment strategy, an investor should know what they want at the end of investing before they begin. If an investor has a set goal, it will give the investor more discipline to stick to them. For example, an investor may also want to set a short-term goal of buying a certain amount of shares of an in-demand stock, like Amazon(NYSE:AMZN). An investor may also set a long-term goal of increasing their portfolio by 15% over a year. A trading strategy will help an investor focus and reach that goal sooner.
2. Test a trading strategy
Once an investor has a plan, they can test it out. Backtesting a trading strategy could help test out the framework for a testing strategy. Using a simulator like TradingSim can help investors try out trading strategies before risking real capital.
Backtesting a trading strategy by analyzing the Dow Jones
3. Set aside a certain amount of time for a strategy
In addition to setting a realistic goal for trading, an investor must decide how much time they can dedicate to an investment plan. If an investor only has limited time to invest in the day, the quick action of day trading may be the best option. If investors want to take a long-term strategy, they can place trades for a longer period of time in swing trading. Investors can also determine a set time to invest each day to keep track of their investment goals.
The other key thing is making sure you spend the time to learn the basics of how to invest in the stock market with affordable introductory courses at a low price point. There is no point in spending a ton of money on anything related to the market until you feel this is something you are interested in over the long haul.
4. Determine which markets to trade.
Once a trader determines how much time to devote to trading, they should choose which market they will choose for investment. Traders may want to just focus on US stocks on the New York Stock Exchange or NASDAQ. For traders who want to explore other options, they can trade foreign exchange currency (forex) or futures.
5. Assess risk tolerance.
An investor must determine how much money they are willing to risk when placing a trade. Ideally, an investor shouldn’t risk any more than 5% of available capital.
Investors can determine a risk-reward ratio as well. A risk-reward ratio can be 1:3 if an investor has a $300 maximum potentially to lose and $600 maximum potentially to gain in investments.
Brandon Pizzurro, portfolio manager of public markets at GuideStone Capital Management in Dallas, noted that risk assessment is crucial, especially in this volatile stock market.
“Investing, in general, requires an assessment of one’s risk tolerance, and never is that risk tolerance tested more than in the midst of a bear market,” said Pizzurro.
6. Always have a stop-loss.
Traders should only risk what they can afford to lose. Instituting a stop loss will help investors stay withing their investing limits, especially in forex. A stop-order loss is a deal to sell a stock once it reaches a certain price. By setting a stop-loss, investors can limit their exposure to risk.
For example, a trader could be trading the euro and dollar at 1.1233. The trader could promise to sell the EUR/USD when it drops below 1.12. A stop-loss can set a limit on how much an investor loses on a trade.
“Whenever I enter a position, I have a predetermined stop [loss]. That is the only way I can sleep. I know where I’m getting out before I get in. The position size on a trade is determined by the stop [loss], and the stop is determined on a technical basis. I always place my stop beyond some technical barrier,” said Kovner.
7. Conduct thorough research.
In addition to having set limits with investing, conducting research is key. Investors can delve into a stock’s earnings report, price-to-earnings ratio, or track an investment on TradingSim’s charts. By conducting thorough research, investors can build a successful trading strategy. The TradingSim chart below shows the way investors can track Apple stock.
Apple stock
8. Have a trading journal
No, the journal isn’t to write about crushes. A daily trading journal can help an investor keep track of how the trades are going and how your plan is doing overall. A trading journal helps an investor keep track of what is working in a trading strategy and what doesn’t work. Trading journals should have these main aspects.
Date and time of trade. Keep track of when trades were made. Trades made in the morning may be more beneficial to investors than trades at different times.
Trace different instruments. An investor may have capital in different instruments, like commodities and stocks. Investors can track the performance of each different instrument to determine how their trading strategy works for each investment.
Entry and exit prices. An investor should keep track of the prices of stocks when they enter and exit trades.
Results of trades. Review the results of the trades. Investors can then go over successes and mistakes.
9. Learn from mistakes.
While checking a trading journal, an investor can notice a pattern in a trading plan-especially, when there are losses. An investor has to learn from mistakes to perfect their trading strategy. Forex trading expert Bill Lipschutz believes that losses are a natural part of trading and that investors can learn from trading losses and errors.
“I don’t think you can consistently be a winning trader if you’re banking on being right more than 50% of the time. You have to figure out how to make money being right only 20 to 30% of the time,” said Lipschutz.
“Poor risk management, for example, using too much leverage. Having a bad risk/reward profile on trades is a staple of poor risk management that I come across (as a rule of thumb a trader should not enter into a trade unless analysis suggests they can make at least ~$2 for every $1 risked),” said Rosenberg.
Knowledge of trading information is important. However, Rosenberg also noted that overanalysis can hinder traders as well.
“Over-complication of the analytical process. Many traders utilize too much information to arrive at decisions, which causes contradiction and indecisive behavior,” said Rosenberg.
An investor can learn what worked and what didn’t work from their trading strategies.
10. Keep trading.
Even if a trading strategy didn’t work, they can learn from their mistakes to continue as a trader. Investors can tweak their strategies or try a new one altogether. Traders shouldn’t get discouraged by losses. They should just re-assess their strategy and stay in the investing game. Investors should stay encouraged by remaining confident and treating investing as the serious business that it is.
Different trading strategies can lead to success
There are many different trading strategies that investors can use. Some of the most popular plans will be explored with the steps mentioned in this TradingSim article.
Day trading can be successful for traders who want quick stock action
Day trading is a popular trading strategy for investors want to make a lot of quick trades- and possibly profits- every day. Short-term trading is the essence of day trading.
Owen Murray, director of investments at Horizon Advisors, notes that day trading may pay off most during a bull market because there are greater profits.
“Day trading typically becomes very popular during bull markets, because on balance, stocks are mostly moving higher and it is easier to make profits,” said Murray.
How to have a better day trading strategy
Day trading can work for traders in a bull or bear market if they take the right precautions. There is no one right way to day trade. However, using the above steps can help create a successful trading strategy. As mentioned in an earlier TradingSim article , investors must treat day trading as a business. Day traders can take these steps to be a more successful trader.
Day traders want to make profits s quickly, so they can set a goal of trading 5 stocks or so a day. As a trader’s confidence and track record grow, they can make dozens of trades a day. However, Merlin Rothfeld, an investment strategist, advises against making so many trades in such a hurry.
“When I started day trading back in 1998, I was a total gunslinger, averaging 550 trades per day,” said Rothfeld. “This caused me to be reckless in my trade selection and execution – not to mention that my broker was making a killing off the commissions I was paying on all those trades. “
“For this reason, I recommend that every day trader set a maximum number of trades to take in a day. Think of it like having a six-shooter: You only have six bullets in your gun, so you better make them count,” added Rothfeld.
Have the capital set aside for day trading.
While day traders may crave the excitement of making lots of trades, they must have the money to make the trades. Day trading is usually the most costly investment. The capital required to trade stocks could climb up to $25,000. Trading futures and commodities like oil may only require about $1,000 to invest in the stock market. The forex market may require about $1,000 or even less. There is no set amount for investing, but day traders shouldn’t risk more than 1% of their capital on trades.
Set aside a lot of time for trades.
Day trading happens quickly all day, so day traders have to be ready to trade at a moment’s notice. Traders must treat day trading as a second job and dedicate hours a day to tracking trades.
The best time to trade could possibly be when the market opens from 9:30 AM-11:30 AM EST. The first two hours of trading are often the most active, so day traders have the potential to earn the most money. The best time to trade futures is usually in the morning as well. Forex can be traded 24 hours a day because of the global trading around the clock.
Test day trading strategies often.
If traders want to try out their strategies before investing capital, backtesting day trading could be best. Day trading strategies can be tested on TradingSim before they’re implemented in real life. Simulated trades can help traders analyze how well or badly their trades are doing. Testing out trades can help determine which strategy is best for day trading. For example, if an investor wants to backtest day trading Coca-Cola stock, they can use charts like the TradingSim chart below.
Coca-Cola stock
Conduct up-to-the-minute research.
Since day trading is so volatile, it’s important to remain on top of financial news. By following blog posts on sites like TradingSim, day traders can stay informed on the latest financial news to make better-informed trades. Day traders should also have an up-to-date trading journal to keep track of the many trades that made.
Have stop-losses to minimize risk.
Stop-losses are important to stay ahead in trading. Kenny Polcari, senior wealth strategist at SlateStone Wealth, noted that it’s important to change course, change position size, and cut losses when necessary.
“Don’t get married to a position just because you like the name. Don’t be married to it if it’s going in the wrong direction. You’ve got to be able to cut your losses and then look at it again at a different time,” said Polcari.
Dennis Dick, proprietary trader and market structure analyst at Bright Trading, notes that it’s important to minimize risk since day trading is one of the most unpredictable trading strategies.
“The goal is to try to eliminate the overall market risk, which is essential in the current market environment,” he says. “Even if a stock has good relative performance, if the overall market has a significant decline, I am likely to lose money on that trade.”
A stop-loss order on a certain stock price will ensure that investors won’t risk more than necessary while making day trades.
Practice and dedication build better day traders
Research, patience, and limiting losses are key to being a successful day trader. Trader Deyanna Angelo noted that day trading is not an easy way to get rich.
“Day trading is a very difficult performance discipline, much like becoming a professional football player or playing a musical instrument to a virtuoso level. You first need to have a natural talent, followed by years of practice,” said Angelo.
Swing trading strategy an option for investors
In addition to day trading, successful trading plans can be applied to swing trading. Swing trading is a trading strategy in which investors strike during two major swings in the stock market. They enter or exit trades when the market swings high or low. In a bull market, swing traders can go long and trade at highs. In a bear market, swing traders can go short and sell when stock prices plunge.
Swing trading is similar to day trading, because an investor holds a stock for a short period of time. However, while several day trades could be placed every day, swing trades could be placed every few day or weeks. Investor Evan Medieros noted that traders should minimize their risk while swing trading stocks.
“I risk anywhere from 0.50 to 1% per trade. Position sizing and managing individual trades include stop losses, both timed & price,” said Medieros.
Similar to day trading, Medeiros noted that he has a series of stocks ready to trade over a few days.
“At any given time, I have 50 to 100 stocks on my bench that I want to get involved in once they ‘set up’. So it is a combination of waiting for the setups and aligning that with my target portfolio exposure, given the market environment, “said Medieros.
Best time of day to swing trade may not be at opening bell
As opposed to day trading, the best time of day to swing trade may not be when the stock market opens at 9:30 EST. At the opening bell, stocks generally move higher, so that may not be the best time for swing trading. When there is a pullback between 10AM-11AM, that may be the best time for swing trading.
Use swing trading indicators
There are three main swing trading indicators that swing traders can use to monitor stocks.
Moving averages
Moving averages help investors identify or confirm trends. In a simple moving average, all the closing prices are added up for a certain number of days. After the addition, the total is divided by the same number. For example, a 10-day moving average would take the closing price of the last 10 days. It would then be added up and divided by 10 to get the average price.
10 -day moving average
2. Relative Strength Index
The relative strength index (RSI), which helps determine if the stock market is overbought or oversold. The RSI is on a chart of 0 to 100. The market is considered overbought if the RSI presents any number over 70. If the price is below 30, the market is considered oversold.
3. Visual analysis indicator.
Visual patterns on charts can help investors easily keep track of what is happening in the stock market.
With indicators and risk management, investors can make the best of swing trading. While day trading isn’t for every trader, with research and persistence, investors can try day trading as a method to potentially increase profits.
Scalping trading strategy another option for investors
In addition to switch trading, scalping trading is another short-term trading strategy that investors can use. It’s similar to day trading, but differs in an important way. Scalping make numerous trades for smaller profits. Scalping traders can profit from small price changes. Instead of holding positions for a few hours or weeks, scalpers may just hold a position for just a few minutes.
Small goals and a lot of time are key to scalp trading
Scalping is about getting smaller profits faster, so incremental goals are pivotal. Traders should start by looking for gains in the range of $0.10-$0.25.
Scalping is such a high-volume trading strategy that quickly changes. So, scalpers need a lot of spare time to monitor the markets. Watching the stock market for hours is a must to catch any slight price changes.
Scalping trading strategy has low risk, but requires high wins
A benefit of scalping is that it is low risk. However, a trader must have a higher number of wins because the profit margin is so minuscule. Traders need a large amount of capital to enact dozens or even hundreds of trades.
Traders should make sure the risk/reward ratio is 1:1. As noted in a previous article about scalp trading, a trader shouldn’t risk more than .1% of their capital on a trade.
If an investor’s trade position is $100 and the stop price is $99.50, the risk and reward must equally be 50 cents. The trader should exit a trade at $100.50 to turn a profit.
Technical analysis can help scalpers
Scalpers can hone their scalping trading skills by using technical skills. Just as moving averages can help with swing trading, they can be useful with scalp trading as well. The simple moving or exponential moving average indicators show the average stock price over a particular time. The exponential moving average may be better for scalpers because it monitors price changes quicker than simple moving averages.
The Stochastic Oscillator Indicator is another way to monitor momentum. Traders use the Stochastic to predict the momentum before a price change. The Stochastic Oscillator and the exponential moving average are just two methods to analyze stocks for scalp trading.
With analysis, a lot of time to invest, and interest in incremental gains, traders can test out the scalping trading strategy.
Position trading strategy is a long-term option for traders
In contrast to scalping, long-term investors that want a longer-term trading strategy can try position trading. Short-term trading can last for minutes or hours. However, position trading can stretch for weeks, months, or even years. Position trading is a long-term stock market trading strategy in which traders want to catch long-term trends in the market.
Position trading strategy may be best for passive traders
Traders that don’t have a lot of time to invest-and more-capital- could try the position trading strategy. For traders that want to more closely emulate long-term investing, position trading could be a better option. Some position traders may just place a few big trades a year, so they can trade part-time if they want. Beginning traders that want to gently wade into trading may find position trading best for them. Position traders hold positions for a longer period of time, so more capital is required to invest.
Bear market may be good time for position trading
Ironically, a bear market may be a better time to try position trading than in bull markets. In a bull market, positions may eventually tumble in a correction. A trader placing positions at the end of a bear market may be in a better position when the stock market eventually recovers. If a position trader is patient and rides out the end of a bear market, they could potentially profit when a bull market comes around again.
Specialized position holding is key
Because a trader is holding a position for a long time, it’s pivotal that position traders have specific holdings. If a position trader focuses on one or two sectors to follow, like tech or healthcare, it will be easier to spot trends.
Position trading uses many research tools
Position trading takes a long-term view, so traders can use two types of analysis. Traders can use fundamental analysis to study earnings reports of stock and overall market trends to determine how to trade.
Position traders can also use technical analysis to monitor their positions. They can use the 200-day exponential moving average to identify long-term trends. It could possibly be a bullish signal when a price of a market rises above the 200-day average. Traders can watch the 200-day exponential moving average to determine where the market is trending.
Traders that have patience and want to minimize risk may find that position trading is the best option for them.
Trend trading may be best for long-term investors
Similar to position trading, trend trading is ideal for traders who want to hold positions for a long time. Trend traders look at a stock’s price trend over a long period of time. A trader then compares the price to broader market trends. An investor then makes a trade based on that knowledge about the market trends.
Legendary trader Paul Tudor Jones noted that the 200-day moving average indicator is important to monitor trends. Trend trading can use the 200-day moving average indicator to watch assets.
“My metric for everything I look at is the 200-day moving average of closing prices. I’ve seen too many things go to zero, stocks, and commodities. The whole trick in investing is: ‘How do I keep from losing everything?’ If you use the 200-day moving average rule, then you get out. You play defense, and you get out, ” said Tudor Jones.
Trend trading requires fewer trades
Google stock the week of March 19
Similar to position trading, few trades are required to start trend trading. A trend trader could just make about a dozen trades a year to remain active.
Because turtle trading is a slow and steady process, trades can be made at any time. There is no rush at the beginning of the day like day trading. There is also no need to wait for a pullback later in the trading day, such as with swing trading. Whether it’s at opening bell in the US stock market or after-hours with forex, turtle trading has a flexible timetable.
“The trend is your friend” in this trading strategy
Financial adviser Ali Hashemian noted that trend trading may be best for trading commodities like oil or gold. The trends in those commodities may be easier to track than stocks, so trend trading may be best for commodities.
“Trend trading is commonly utilized by commodity traders. Most often this trading style will include price calculations, moving averages, and take-profit or stop-loss provisions. Traders will use price movement and technical tools to determine trading signals,” said Hashemian.
Trend trade signals and indicators help traders make best picks
A number of different trade signals can be used, and traditionally there are set rules and risk controls put into place when using this trading strategy. Other than the moving average, there’s the Moving Average Convergence Divergence (MACD). If the MACD moves above 0, that’s usually a sign to buy. If the MACD moves below 0, that’s usually a bearish sign for trend traders to sell their assets.
The aforementioned relative strength index (RSI) signals a buy trend if it moves above 50. An on-balance volume indicator can be used to measure an asset’s trading volume. Joseph Granville, the developer of the metric, believed that an increased volume in an asset means a bullish or bearish turn.
Risk management key to trend trading
Famed trend trader Paul Tudor Jones also advises having a “5:1 risk /reward. Five to one means I’m risking one dollar to make five. What five to one does is allow you to have a hit ratio of 20%”, said Tudor Jones. Minimizing risk is key to get ahead in trend trading. A maximum 2% stop is also advisable for beginning turtle traders.
Turtle trading is most famous form of trend trading
Turtle trading is the most famous form of trend trading. The popular method emphasizes a purely technical and methodical approach to trades. Financial analyst Zaheer Anwari noted that turtle trading can pay off if traders are patient and emotionally detached while making trades.
“With time and experience, it becomes a detached, robotic and stress-free approach to the markets, as the initial risk is always very low and well managed and only the very best trades are taken,” said Anwari.
Turtle trading could be best for traders who want to bide their time in the markets. The turtle trading strategy could also work traders who want or need set trading rules.
Different trading strategies can help create success
There is no one trading strategy that will create a successful framework for a trading strategy. Just as the stock market is different every day, so is a trader. What may work one day may change the next. However, the 10 steps and specific trading strategies will help traders make better choices.
TradingSim’s charts and articles can help beginning or experienced traders develop the best trading strategies to navigate the volatile stock market. With a methodical framework that makes room for flexibility, traders could find a trading strategy that works best for them.
Why Read Books on Trading
Trading is no different than any other profession. When you were going to school at any grade level you likely had books that covered all tops of topics.
For me, I had actual hardback books that I would have to take to and from school. Well think of all the books you needed to consume for school, well at a minimum you need to read at least that many when it comes to trading.
Course Catalog – How This Post Is Unique
The one key difference between the classroom is that you are not given a proctor or list of stock trading for beginners books to read to take you through the journey of becoming a trader.
You can, of course, go the route of becoming a certified market technician which will give you course materials, or you can signup with any number of trading educators you can find around the web.
Another option may be turning to a writing service that can provide a brief summary of any book. It will allow you to save some time and have.a third-party give an objective opening.
But if you want to take the self-taught route, you will have to figure out which books to read and in what order.
This is where I feel this post will be slightly different than the others you will find on the web.
I will lay out in order the best trading books you should read to give you a roadmap of sorts.
A. The Basics
In the beginning, you are likely trying o figure out where to start. This feeling will never quite go away to be honest. You will just cast a more narrow net, but go deeper as you progress in your career.
So, for just starting out you will want to get a handle on the markets in general.
#1 – Stock Investing for Dummies
These books are still a great resource for gaining a ground-level understanding of various topics. The dummies series has great books related to the topic of trading as well.
Stock Investing for Dummies
Let me be the first to say this book is simply meant to provide you with some insight into investing. It is not meant for you to pick up and start using to trade right away.
However, the book gives you a complete view into the world of investing in stocks. The author Paul Mladjenovic who is a certified financial planner and has been in the business since the early 80’s gives you a wealth of information for you to dissect.
The book has over 25 chapters for you to digest, so there is no shortage of information. The topics range from the essentials of stock investing to how to pick stocks.
After reading this book, your head may feel like it’s going to pop off, but you will have a much better handle on the investing world.
Now this book is going to be a lot to process and is a dry read; however, it is a necessary evil. Within this book, you will gain exposure to additional indicators beyond simple moving averages and popular oscillators discussed in the stock investing for dummies book.
You will now begin to learn about tools like the absolute breadth index and other indicators available in professional trading platforms.
The goal of reading this book is to familiarize yourself with technical analysis and to assess which indicators best fit your trading style.
#3 – Japanese Candlestick Charting Techniques: A Contemporary Guide to the Ancient Investment Techniques of the Far East, Second Edition
Japanese Candelstick Charting Techniques
If you look across the web and YouTube you will notice that the most popular charting type is the candlestick. You will want to learn how to master this form of analysis on the chart in order for you to better understand the makeup of the market. The book by Steve Nison gives a great introduction to the basic candlestick patterns and then goes into more advanced patterns.
#4 – One Good Trade
One Good Trade
Now that we have covered the basics of stock investing, we need to start getting into how to place trades. Remember, you are looking for books on how to trade – not invest.
These are two very different approaches. Investing is more of a passive method for generating income while trading is where you are an active participant in the market seeking to reap gains.
Well, the next book is a classic written by Mike Bellafiore titled ‘One Good Trade‘ who is one of the co-founders of SMB Capital.
The book has 13 chapters and covers what it means to be a trader. I feel it’s good to go right into it, so you have a feel for what it means to be a trader. This book is very unique because you can hear not from an academic but from someone that has built a successful prop trading firm.
What you will notice right away is the book touches upon real-life experiences and people in order to help you see what it means to trade for a living.
B. Fundamental Analysis
Now for those of you that are looking for books covering financial ratios and long-term investing, this is beyond the scope of this article. Since the title of this post is stock trading, we are discussing books that require active trading.
Fundamental analysis requires a much longer-term view of the markets and is not so concerned with time trades.
C. Mimic the Winners
Like anything else in life, you want to find those that are doing extremely well and follow their lead. Below are a number of books that can help you identify these trading gurus, so you can mirror their success.
#5 – Market Wizards – Interviews with Top Traders
Now this series of books are simply timeless. The series written by author Jack D. Schwager gives you a front-row seat into his interviews with successful traders to better understand their techniques.
On the surface, this sounds simple, but imagine trying to convince someone to share their approach to trading after it has made them wildly successful. This, my friend, had to be a serious challenge.
Jack has written a number of wizards books that cover everything from old school futures traders to the modern-day hedge fund managers.
To see the full list of wizards books, perform a search for Jack D. Schwager on Amazon.
Market Wizards
#6 -Momo Traders: Tips, Tricks, and Strategies from Ten Top Traders
This book is for those of you that are interested in trading penny stocks. I purposely listed this further down the list, so you have a greater grasp of the markets and trading before delving right into these types of setups.
D. Trading Psychology
Beyond all the technical books and complicated strategies, you also need to have a handle on trading psychology. This is essentially you keeping your head on straight when trading the markets.
It goes without saying the hardest part of trading is not falling victim to mental sabotage as you navigate the markets.
To help with this, I recommend you read the following books:
#7 – Trading in the Zone
Without a doubt one of my favorite books on trading. Author Mark Douglas stresses the point of accepting the risk on each trade. You cannot control the outcomes, but you can accept the risk and trade to your plan.
Trading in the Zone
#8 – Daily Trading Coach
Daily Trading Coach
Dr. Steenbarger is one of the most sought-after leaders in the trading world. He has conducted extensive research working with top traders around the world.
Well in ‘The Daily Trading Coach‘ Dr. Steenbarger gives you a play-by-play of how to police yourself and your trading behaviors. This is essential if you are going to go beyond identifying the setups but keeping your emotions in check.
How Can TradingSim Help?
Once you are done reading these books, come over to Tradingsim where you can practice the strategies and techniques to help you develop a winning strategy.

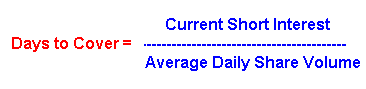

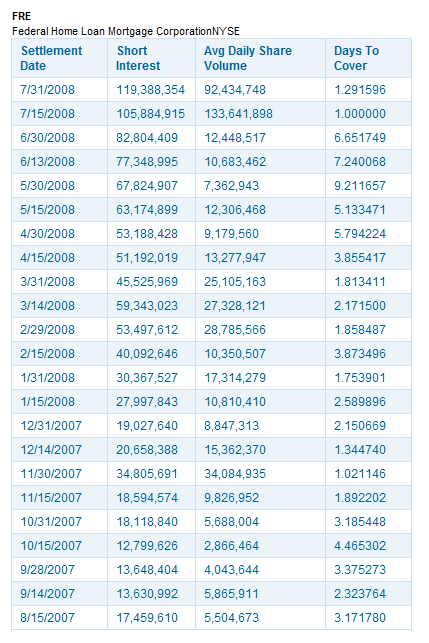


![Candlestick Patterns Explained [Plus Free Cheat Sheet]](https://app.tradingsim.com/wp-content/uploads/2021/06/image-1.png)