Simplest Approach for How to Make Money Trading Stocks

Trading stocks is a daunting task and turning a profit trading stocks is even more difficult.  There are literally thousands of books and articles on the web related to trading and the path to riches.

Each author has their theories of how best to trade, but how do you make sense of it all.  Well, in this article I will cover a simple approach for how to make money trading stocks focusing on 6 key components.

So, What’s the System?

First off, you need to have your own edge for trading.  Quite frankly, it can be anything as long as you have taken some time back testing the system and have had some success.

Just to back up for a second, the title of this section may throw you off a bit.  You are probably saying to yourself that the strategy is what makes you successful, and this couldn’t be the furthest thing from the truth.

I could spend days or even weeks training you on the best strategy and you are still likely to find a way to sabotage your own success.  After all, only 10% of traders turn a profit in this the greatest of all games – investing.

The truth of the matter is that the system is really just the tool.  You my friend are the key to your success when it comes to trading stocks.

Don’t Overlook the Importance of Money Management

money management
money management

After you have been trading for some time, you will quickly realize that picking winners is only a portion of the success equation.  Money management is right up there at the top of the list, which is why I am starting with this topic.

First off, you don’t need to use much margin or any margin at all.  If you are any good, you will be able to grow your account exponentially from your hard work.

Next, whether you are day trading or swing trading, never use more than 33% of your account on any trade.  This way if you somehow manage to completely blow up your account on a trade, at most you will lose a third of your account.

While this would represent a major setback, you will still be in the game.

So, if you feel the need to hit a home run – get over it.  Trading is a business and should be treated as such.

Stop Loss are a Must

You have to know when you are wrong on a trade and more importantly. you need to get out using a stop loss when this occurs.  To this point, for day traders, you never want to lose more than 2% on any trade.

For swing traders, you never want to lose more than 11%.  You may ask why these percentages. Which is a fair question.

For day trading, based on the volatility I trade, after a 2% loss I am either headed for a much larger bath or the stock has very little chance of recovering and turning me a profit.

For swing trades, I tend to give the stock more room as I am operating on a larger time frame and have a longer holding pattern.  Hence, 11% gives me enough breathing room to avoid a shakeout.

Again, since you are using a maximum of one third on any position, when day trading you would lose only .66% of your portfolio and when swing trading 3.67%.

With numbers this small, odds are in your favor that you will be able to stay in the trading business long enough in order to figure out how to exponentially grow your account.
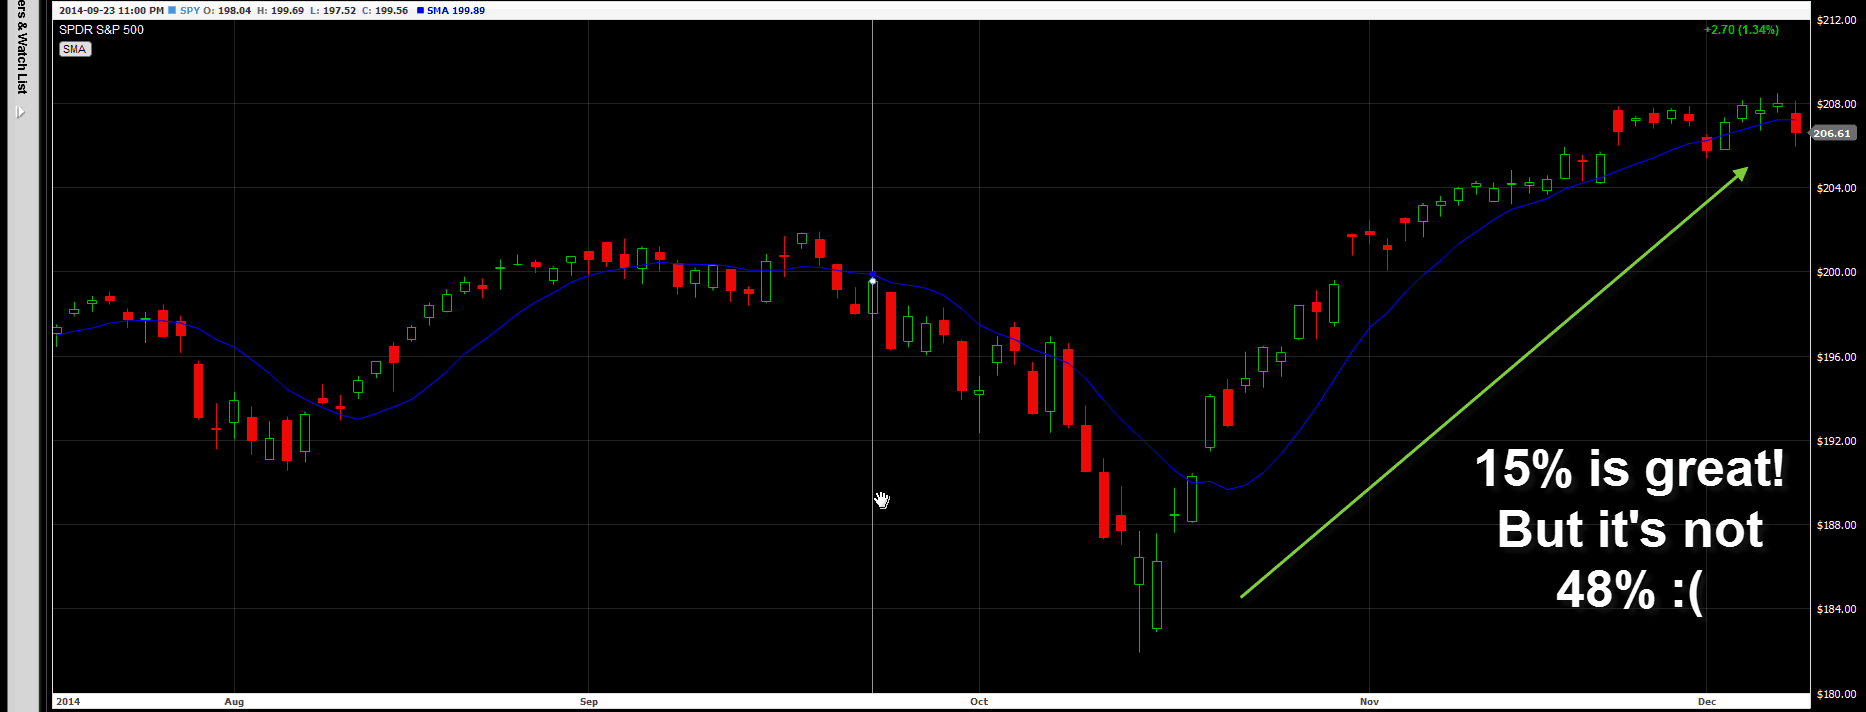
Set a Profit Target

Profits
Profits

I have done both – not set profit targets and have set prices where I exit the position no matter what.  While not setting profits is far more exciting and I will occasionally hit a home run, for consistent profits, exiting at profit targets has always made me the most money.

When day trading, there are two targets I like to use.  The first is 1.68% as this is slightly below 2%.  You may ask yourself why this number. Well, it’s actually a simple answer.  For starters, I buy or sell breakouts and these will often only run to a point before reversing.  Secondly, I like to trade stocks with some volatility but not too much.  For this reason, the stocks I trade will often begin to go flat or reverse right around the 2% mark, hence I exit before this level is touched.

Once you get in a good rhythm and are able to judge when it’s best to exit a position, the next profit target up which I now use is 4%.

Going back to the previous section regarding stop loss, this gives me a 2 to 1 reward risk ratio.  In reality, the 2% loss is rarely triggered, so my true reward risk ratio will land in the 3 to 1 range.

For my swing traders the profit target I use is 35%.  This represents a healthy gain, but not too crazy where you may find yourself looking for the home run.

While 2% and 35% represent the targets, you also have to realize these are just that – targets.

While a stock is moving in your favor, at times they will not hit your target.

Therefore, as part of your system, you need to identify a method for trailing your profits, so if the stock has a change in plans, you can exit the trade with a profit.

There is nothing worst in trading, then letting a winner turn into a breakeven trade or a losing one.

For all you artist out there that say let the market run, why limit your gains.  I’m over it.  For me, taking the money out of the market and putting it in my pocket is the only way I have been able to generate a steady equity curve over the years.

Whenever I start to get cute and try to make a trade into more than just a trade, I get in trouble.  Please don’t make the same mistake.

Yes, You Need a Time Stop

Time
Time

For some reason, I feel like I’m the only guy talking about time stops.  For those of you unfamiliar with the concept, a time stop is when you exit a position after a certain period of time if the stock is not performing as predicted.

You may have heard traders say time and time again, let your winners run and cut your losers.  Well, what happens when your losers are not triggering your stop loss, but have not hit your profit target?

This scenario would result in me just sitting in the position, with my fingers crossed or worst paralyzed.

To help alleviate this symptom, please say hello to your new best friend – the time stop.

After I purchase a stock between 9:50 and 10:10 am, if the stock does not move within 30 minutes, I will exit the position.

Since I trade breakouts in the morning, if the stock is still unsure of itself 30 minutes after breaking out, then something is clearly wrong with the move.

For swing trading, I give my position 3 weeks to do something.  If after 3 weeks, I am staring at a small gain or loss, I just exit the position and look for other opportunities.

The time stop is the key to making sure you avoid the negative impacts of opportunity costs of sitting in a position too long.  There is always another trade and it is your job to find the next trading opportunity.

Some people may get rich off one trade; however, to make a living at day trading you will need a track record with literally thousands of trades.

Take Money Out of the Market

Look around the web and you can count on one hand how many articles talk about the need to take money out of the market.

Every blogger and trading guru is willing to tell you how to make the money, but none of them talk about out to grow your account, while still maintaining a healthy relationship with the money in your account.

To be blunt, if you never take the money out of your account, you will never have an appreciation for the digital numbers making up your account balance on your monitor.

If you are trading for a living, you will obviously take out the necessary money to pay your bills.

However, what if you have a day job and don’t necessarily need to pull out any cash – how much should you reinvest?

I have struggled with the percentages over the years and I think my struggle really boiled down to greed.  I always wanted more, so it never occurred to me to take money out even when I had windfall trades of 100k.

To help fight this naive view of money, I now take out 10% of trading profits on every trade.  The only requirement I have is that my account must make a new high in order for me to withdraw funds.

Therefore, if I make money in the market, 10% of the profits flow through to my checking account. This allows me to realize the value of the money and it also allows me to share with my family the fruits of my labor.

Remember, your family is going along with you on this journey and more than likely, they didn’t ask for a ticket.  So, it’s important that you are able to share the successes with those close to you so they can share in the spoils of success.

In Summary

Trading comes down to the following 6 key components:

  1. Decent trading system (again not the most important component)
  2. Money Management
  3. Stop Losses
  4. Profit Targets
  5. Time Stops
  6. Pay Yourself

I tried to fit it all on one hand, but I went over by one.  As you can see, this is a short list.  If you incorporate these items into your trading system, you will do just fine.

Much Success,

Al

Photo Credit

Money Management by Morgan

Profits by KMR Photography

Time by Heiko Klingele

In the true spirit of the Tradingsim blog, we will quickly cover the definition of leveraged ETFs, so we can dive into the details of whether you should day trade, swing trade or invest in leveraged ETFs.

Background on Leveraged ETFs

What are Leveraged ETFs?

Leveraged ETFs are an investment vehicle that provide additional exposure to the base unit price of an investment vehicle in order to increase the monetary impacts of price fluctuations.  The standard leverage ratios for leveraged ETFs is 2:1 and 3:1 ratio relative to the price of the underlying instrument.

There are complicated back office processes (daily rebalancing, use of borrowed money, accounting practices and investment in index futures) in order to ensure the value of the leveraged ETF continues to perform at the stated ratio (2:1 or 3:1) of the underlying instrument.

While you may get a kick out of knowing the math and inner workings of the finance world that generate leveraged ETFs, it is really of no consequence, as long as you make money. Therefore, if you are working on a finance paper for college, you should probably hit back on Google; however, if you want tangible lessons on how to trade leveraged ETFs, you are in the right place.

Types of Leveraged ETFs

Back in 2006, four leveraged ETFs were approved by the SEC after many years of scrutiny.  Today, there are over 200 leveraged ETFs. Leveraged ETFs cover the obvious whales such as the S&P 500, Dow, QQQ, and Russell 2000 index. For the more sophisticated investors, you can find leveraged ETFs for Natural Gas, Silver, Cocoa, and the 10-Year Treasury.

In addition to the wide variety of leveraged ETFs and ratios (2:1 or 3:1), you also have the choice of buying long or inverted (shorting).

Risks of investing in Leveraged ETFs

Before we get into the specific trading strategies, you will need to grasp the level of risk you are taking on in your quest for profits. Trading is hard enough only using cash, but introduce leveraged ETFs and things can quickly get out of hand.

Margin Rules and Leveraged ETFs

When I first heard of leveraged ETFs years ago, my initial reaction was this is bad for the trading community because of the increased leverage.  Before doing any research, I assumed leveraged ETFs were indirectly increasing the standard 2:1 margin offered by brokerage firms by allowing you to invest margin funds in the 2:1 or 3:1 leveraged ETFs.

Well, do not get too worked up, because while this is mathematically possible, the finance world will not allow it.

While you may be willing to risk Junior’s college education, brokerage firms are not willing to risk their own money. To illustrate this point, if you are trading a 2X leveraged ETF, most brokerage firms will require you to have 75% or more cash for the open position. Bottom line, brokerage firms require you bring cash to the table in order to protect their risk of loss.

When you can make the most bang for your buck with Leveraged ETFs

Now that we have satisfied the academia crowd, let’s dig into how to make and protect money when trading leveraged ETFs.

Day Trading with Leveraged ETFs

I am a firm believer that you should trade the active stocks of the day; the stocks that are showing sizeable gains or losses with increased volume. Due to the borrowing limitations placed on leveraged ETFs by brokerage firms, I do not see the value in day trading these instruments. You will be better off trading the hot stocks of the day and still being able to use four times your cash on hand, which is the standard day trading margin extended to traders with at least $25,000.

For example, on an average trading day, the S&P 500 may have a 2% trading range. This would produce a possible profit of 6% high to low if you were able to time the price movement perfectly. However, while the price range is size able, due to the margin requirements you will have a good amount of cash tied up in the trade.

On the other hand, if you are day trading the hot stock of the day, the price swing could be 10% or more.

The thing that makes day trading the hot stock more attractive is the hot stock of the day will likely not have special margin requirements. This will allow you to not only trade the more volatile stock, but also use more of the brokerage firm’s money in your quest for profits.

Swing Trading with Leveraged ETFs

When it comes to swing trading, you can generate significant profits if you can accurately time big moves in the market. For example, as I am writing this article, there was a major bottom placed in the market in October 2014.

The ProShares UltraPro S&P 500 bottomed on October 14 at $91.48. From this low, the ETF has rallied to a high of $135.80 as of November 21, 2014. That represents a 48% percentage gain in a little over a month.


Pro Shares Ultra S&P500

If you had bought the SPY ETF over the same period of time you would have only made ~15%. 15% is a great return over 6 weeks, but it pales in comparison to the 48% from the ProShares Ultra Pro S&P 500.

Now, some of you maybe scratching your head wondering why I would suggest swing trading ETFs versus day trading and it simply comes down to the return potential. You can make more money day trading the hot stocks than you can make day trading leveraged ETFs due to the tighter price range swings and stiff intraday margin requirements.  Conversely, when it comes to swing trading, leveraged ETFs provide the ability to make considerable gains if you are able to catch a vertical move and of course resist the urge to sell out too quickly.

Long-term Investing/Buy-Hold Strategies and Leveraged ETFs

I do not believe we have enough trade data for leveraged ETFs to definitively state that a buy and hold strategy over the long haul (10+ years) will produce positive returns for investors.

You maybe scratching your head saying, if the S&P 500 returned 10% over a 2-year period, then I would have made 20% in a 2:1 leveraged ETF.  The simple response to this statement is wrong!

The SEC has posted alerts on their site explaining the dangers of investing in leveraged ETFs.  This isn’t something necessarily to cause a retreat, since the SEC warns against the dangers of day trading; however, there is math to support their claim of why long-term investing in leveraged ETFs is bad for an investor.  Below are a few excerpts from the alert which you can find using the following link:

” The following two real-life examples illustrate how returns on a leveraged or inverse ETF over longer periods can differ significantly from the performance (or inverse of the performance) of their underlying index or benchmark during the same period of time.

  • Between December 1, 2008, and April 30, 2009, a particular index gained 2 percent. However, a leveraged ETF seeking to deliver twice that index’s daily return fell by 6 percent—and an inverse ETF seeking to deliver twice the inverse of the index’s daily return fell by 25 percent.
  • During that same period, an ETF seeking to deliver three times the daily return of a different index fell 53 percent, while the underlying index actually gained around 8 percent. An ETF seeking to deliver three times the inverse of the index’s daily return declined by 90 percent over the same period.”

The alert then goes on to provide the math of how this under performance by the leveraged and inverse ETF is possible.

“How can this apparent breakdown between longer term index returns and ETF returns happen? Here’s a hypothetical example: let’s say that on Day 1, an index starts with a value of 100 and a leveraged ETF that seeks to double the return of the index starts at $100. If the index drops by 10 points on Day 1, it has a 10 percent loss and a resulting value of 90. Assuming it achieved its stated objective, the leveraged ETF would therefore drop 20 percent on that day and have an ending value of $80. On Day 2, if the index rises 10 percent, the index value increases to 99. For the ETF, its value for Day 2 would rise by 20 percent, which means the ETF would have a value of $96. On both days, the leveraged ETF did exactly what it was supposed to do – it produced daily returns that were two times the daily index returns. But let’s look at the results over the 2 day period: the index lost 1 percent (it fell from 100 to 99) while the 2x leveraged ETF lost 4 percent (it fell from $100 to $96). That means that over the two day period, the ETF’s negative returns were 4 times as much as the two-day return of the index instead of 2 times the return.”

Let’s say you ignore all of this and say to yourself, well I would still be up more than investing in the underlying instrument, let me show you a few charts that may provide you a dose of reality.

Take a look at the below chart of the recent 4.5 year bull market run.

SSO 5 Year Return
SSO 5 Year Return

The returns are silly when you compare them to the S&P 500. But honestly, how many people have been calling for the top of this run, which is well beyond the average bull run of 3.8 years.

Bottom line, the returns look great on a historical chart, versus the reality of being able to time the moves and sit through all of the gyrations.

Short a.k.a Inverted ETFs

Inverted leveraged ETFs provide the ability to take a bear position on the market, without the unlimited risk to the upside that a short position contains.

The challenge with buying an inverted leveraged ETF is that you could get it wrong. That last sentence may seem like the obvious conundrum of trading, but the market has a natural bias to the long side, so nailing bottoms is always easier then picking tops. For this reason, I do not advocate buying inverted leveraged ETFs, because if you get it wrong your losses can quickly mount as bull markets drag out. Even if you manage your money correctly and can withstand a serious hit to your account, you still have the opportunity costs of sitting in a losing position for an extended period.

If you do not believe me, look at the 3X Inverted SPY ETF since 2012.

Leveraged ETF - Pro Shares Ultra Short S&P500 5-Year Chart
Pro Shares Ultra Short S&P500 5-Year Chart

If you are a permabar, each low point in the market was followed by another high in the market. Looking at that chart, my heart goes out to anyone that took on an all-in position near the bottom and have been waiting for some sort of return.

The Simple Reason I personally do not trade Leveraged ETFs

This title could be throwing you for a loop, but please hear me out first before you label me a flip flopper.

If you step back for a second, strip away all of the complicated algorithms for leveraged ETFs and look at the instrument for its real purpose, it boils down to greed.

Why do traders need to get involved with something that is 3 times the value of its underlying security? Isn’t your cash enough for you to make a healthy profit if you use a sound trading system over an extended period of time?

Today there are only 3X leveraged ETFs offered, but would you trade a leveraged ETF that was 5X or 10X, if it was allowed by the SEC? When does it all end?

As a trader, you are better off focusing on mastering your craft and making consistent gains over an extended period of time, resulting in a steadily increasing equity curve.

The need to nail the big one can be catastrophic if you are unable to get it just right. So, if you are looking to invest in the broad market and you do not want to get involved in trading futures, just trade the ETFs that mirror the movement of an index. Leave the leveraged instruments to the riverboat gamblers.

Popularity Dying Out or a result of low volatility in the market?

The popularity of leveraged ETFs was at its height with the initiation of a number of ETFs in the ‘08 and ‘09 timeframe. This coincidentally tied into high volatility in the market. Take it for what it’s worth, but notice how the monthly volume in the below ETFs has plummeted over the last 5 years.

The volume in the UPRO is down over 60%.

Leveraged ETF - UPRO Proshares Ultra Pro SP500 Volume
UPRO Proshares Ultra Pro SP500 Volume


Volume in DTO (Power Shares DB Crude Oil Double Short ETN) is down ~50% from ‘08 to ‘09.

Leveraged ETF - DTO Voluime - PowerShares DB Crude Oil Double Short ETN
DTO Voluime – PowerShares DB Crude Oil Double Short ETN

UGL (ProShares Ultra Gold) volume is down ~50% from the ‘08 to ‘09 timeframe.

UGL ProShares Ultra Gold NYSE

Therefore, we have to ask ourselves if this drop in volume is a result of waning interest in leveraged ETFs, or if leveraged ETFs need volatility for market participants to step in and start trading these issues.

Unless this bull market comes to an immediate stop or we shoot up to a new high in an impulsive fashion, low volatility is like to continue over the near term.

Leveraged ETFs Closing Down

For those of you that think I’m just a big scaredy cat and that’s why I don’t trade leveraged ETFs, don’t take it from me, listen to the people that make a living offering these investment vehicles.  There was an article posted on ETF Trends stating that ProShares will be closing 17 inverted ETFs in January 2015.  The article goes onto say that over 100 ETFs have been closed in 2014 and in the near future ProShares is focusing on expanding its non-leveraged funds.

Since ProShares is the largest issuer of  leveraged and inverse ETFs, I would follow the smart money and expect interest in these ETFs to continue to decrease over time.

In Summary

The bottom line is if you are going to trade leveraged ETFs you can swing or day trade them, but you should not plan on investing in these instruments over the long haul.

The fact that ProShares is closing down ETFs, the SEC has posted alert bulletins, and the math can have you losing money while the chart shows a positive return, should give you reason to pause.

There are so many ways you can make money in the market, so you will have to ask yourself if leveraged ETFs are worth the risk.

Leveraged ETF Resources

Tradingsim Market Replay Platform

The Tradingsim market replay platform has every leveraged and inverted ETF with intraday data going back for the last 18 months.  If I cannot sway you from day trading these instruments, please practice trading a few months to see how it affects your bottom line.

Below is a list of leveraged ETFs you can use to research the best investment opportunities based on your trading style and interests:
List of 2X Leveraged ETFs and 3X Leveraged ETFs

Long-term stock charts courtesy of Stockcharts.com

As always, good luck trading and remember to enjoy the journey of becoming a master trader.

Al Hill

Death Cross Example

The death cross sounds so dramatic.  The death cross is when a short-term moving average crosses to the downside through a long-term moving average.  The most commonly used moving averages when assessing a death cross are the 50-day moving average and the 200-day moving average.

After reading the above paragraph, that’s pretty much all you will find on the web.  In this article we are going to take it a step further and provide you 5 reasons of why you should not panic when a death cross occurs.

#1 The Death Cross is really just a guidepost

When you think about the death cross, it’s really just a way of identifying when a long-term trend is in jeopardy, because the short-term average is trending harshly to the negative side.

Now, if you are a 5-minute or 15-minute trader why do you care?  I would dare to say no.

This is where people get caught up in the title of ‘death cross’.  It sounds like something we all should be terrified of and just run to the hills.  While it makes for a great storyline on CNBC after the market has had a long bull run, to us traders, it’s really just noise depending on the timeframe you trade.

Now, if you are a swing trader or long-term investor, definitely take pause when a death cross occurs.  When I say pause, this doesn’t mean panic; look for additional clues of where the stock will go.  For example, is the stock hitting a previous support area or going back into a congestion zone?

Again, a death cross is not a reason to pack it in, but more of a time to assess your trade and the future profit potential.

#2 Everyone knows about the death cross

A general trading rule is that the more people know about something, the less likely it will occur.  So, where is your trading edge when using the death cross?  How are you using information that isn’t readily available to other traders to make your decision?

When I think about the death cross and trading, it’s less to do with me making a decision based on the death cross and it’s more about watching how other traders react to the technicals.

If everyone begins to panic sell, I will sit tight and wait for the weak longs to exit.  If the death cross occurs in conjunction with the break of a major support level, I will likely exit the position on the next bounce.  Not because of the death cross, but because of a breach of support.

#3 The Death Cross is a lagging indicator

The death cross is based on moving averages.  By default, moving averages are lagging because they are based on a pre-defined look back period.  Death crosses have even more of a lag, because it is looking back 50 and 200 day periods.  This translates into almost 3 months of trading for the short-term average and approximately 40 weeks for the long-term average.

Think about that for a second.  These are some pretty long look back periods.  If you are trading a volatile stock, a whole lot can happen in the next 3 to 9 months.  With this much of a lag, there is the possibility that other traders have already priced in the fear and you could be showing up late to the party with your short trade.

#4 The traders of your stock may not care much about the death cross

Every stock has a controlling interest at any given point in time.  There are some investors that exclusively trade certain securities and the stock moves in a repeatable fashion.  This controlling interest may trade the stock based on the slow stochastics or they may trade based on fundamentals.  Or the controlling interest may be trading the stock as a hedge for another position in their portfolio.

The point I’m trying to get across is there are so many factors that could play into what the controlling interest of your stock could be monitoring at any given time.  So, why get wrapped up into the fact there was a death cross?

#5 Death Crosses don’t mean much when it comes to the broad market

Now that we have in theory drained the concept that death crosses aren’t really anything to worry about, let’s now focus on the actual data.  I’m going to look back at the last 5 death crosses on the iShares Russell 2000 Index Fund ETF (IWM) and where the ETF was trading 1 year after the death cross.

Death Cross #1 – August 12th, 2011

Since the market has been in a strong uptrend over the last few years, the last death cross for IWM was on August 12th, 2011.  The IWM on that day closed at $69.79.  Fast forward one year and on August 13th, 2012 (12th was the weekend), IWM closed at $79.79.  This represents a gain of 14.4%.

Death Cross 1

Death Cross #2 – July 28th, 2010

IWM on July 28th, 2010 closed at $65.15.  Fast forward one year and on July 28th, 2011 IWM closed at $79.84.  This represents a gain of 22.5%.

Death Cross 2

Death Cross #3 – October 8th, 2008

This death cross was exceptional because it was in the thick of the mortgage crisis.  On that day, IWM closed at $54.46 on October 8th, 2008.  Now, please jump in my time machine and fast forward to October 9th, 2009 and you will see IWM closed at $61.42.  This represents a gain of 12.7% one year after the death crosses of all death crosses during the mortgage crisis.

Death Cross 3

Death Cross #4 – September 7th, 2007

IWM on September 7th, 2007 closed at $77.66.  Fast forward one year and on September 5th, 2008 (7th was Labor Day), IWM closed at $71.64.  This represents a loss of 7.8%.  This is the first loss we’ve encountered through this analysis, but I wouldn’t use words like “death” in the same sentence with a 7% loss.

Death Cross 4

Death Cross #5 – July 21st, 2006

On July 21st 2006, IWM closed at $66.75.  Fast forward to July 20th, 2007 (21st was the weekend), IWM closed at $83.20.  This represents a gain of 24.6% one year after the death cross.

Death Cross 5

Let’s try look at the data in a summary table view.

# Date of IWM Death Cross Death Cross Closing Value IWM Closing Price One Year after Death Cross % gain or (loss)
1 8/12/2011 $69.79 $79.79 14.4%
2 7/28/2010 $65.15 $79.84 22.5%
3 10/8/2008 $54.46 $61.42 12.7%
4 9/7/2007 $77.66 $71.64 (7.8%)
5 7/21/2006 $66.75 $83.20 24.6%
13.28% (average)

So, after all the numbers have been tallied, there is an average return of 13.28% for the IWM over the last 8 years.  Out of the 5 death cross occurrences, only 1 was negative and the other 4 provided double digit gains.

In Summary

This analysis goes back the last 8 years in the market.  Now, if we were to go back 10 or even 20 years, the results may not be as positive, but is there any reason to run for the hills if you are a long term investor?  Call me crazy but the death cross could actually be used as a contrarian technique for trading the markets.

Why Selling at Resistance is a good idea

The purpose of trading is to make money.  It’s not to pick up an expensive hobby, or a place to gamble away your retirement fund.  So, while this article may sound like a common sense topic, far too many traders forget that selling or closing a position is the key to turning a profit.

Selling at a predefined resistance level is a basic way to define parameters of when you should exit a trade.  If you read my previous article on how to buy a stock at support, then this article will provide you the insight on how to close out a position.

After reading this article you will know how to:

  1. Place an order to sell a stock
  2. Able to identify optimum selling opportunities
  3. Know when it is a bad time to sell
  4. Know when to go short

How to enter a Sell Order

For you expert traders out there, you can skip this section of the article.

For everyone else, you first want to determine the type of order you want to enter.  Market orders if you are just looking to get out on momentum or a limit order if you want to have more control around your actual exit price.

You will also need to know the number of shares you are currently holding of the stock and lastly you will need to know the symbol.

So to quickly recap you need 3 things: (1) order type, (2) number of shares and (3) stock symbol.

Below is a screenshot of a sell order to sell 1,000 shares of Facebook.

Sell Order - Tradingsim Platform

Selling at Resistance Levels within a Channel

Figuring out where to sell in the confines of a channel is a traders dream.  Reason being, there are upper and lower boundaries which provide clear support and resistance levels.

Even though trading is a honed skill, at the end of the day it’s not that complicated.  Remember, we all have access to the same charts and technical analysis, so odds are we will all draw the same conclusions.

Below is a chart from the stock XOMA.  Notice how the stock has been trading in or around a clear channel since late 2012.  The key thing to note here is that while the stock is pretty volatile, when approaching the resistance XOMA consistently backed off to support.

Selling During an Uptrend

Selling in uptrend channels should be used as an opportunity to close out long positions.  The trend is clearly to the upside, so while shorting could be profitable, remember the market always has surprises and these surprises are generally in the direction of the primary trend.

Shorting in Downtrend Channels

To this point in the article we have only discussed closing out a long trade by selling the position.  However, when trading a downtrend channel, you will want to use the test of the top of the channel as an opportunity to get short.

Shorting During a Downtrend

The above chart is of the stock Proof Point (PFPT) which experienced a sharp downtrend from March through the end of April.  Once the downtrend channel was defined, there was an excellent opportunity to short the top of the channel test for the push down to the support line.

The key thing to remember is that for stocks in an uptrend, you want to sell long positions at the top of the trendline and in downtrends you want to use the test of the upper trendline to sell short.

Resistance in the form of recent swing highs

Outside of trend channels, resistance can rear its ugly head at key swing points (clearly you can see I like going long).  Unlike channels which provide clear repetitive trading points, a swing high may be the only decision point you can find on the chart.  You will have to make the call of whether that swing point will likely trigger a reversal or a bump on the road to higher prices.

To gauge the significance of a swing high, the biggest indicator is the volume when the stock sets the high.  If the volume on the second test is much higher and the stock is able to close above the last swing high, odds are in your favor for higher prices and you will likely not want to close your long position.

However, if the stock approaches the last swing high and either has a 20% increase or decrease in volume and closes below the last swing high, odds are the stock will reverse and go lower and you will likely want to open a short position.

You could be asking yourself why it would be a bad thing if the stock has higher volume even though it closes below the swing high.  While the volume is higher, the bulls were unable to maintain control on the close which is an early indication the stock could be experiencing a blow off top.

An example of this can be seen with XOMA below.  Notice how the stock ticked over the last swing high with increased volume, only to retreat and begin a vicious 2 month sell off that saw the stock lose over 50% of its value.

Swing Highs

When it’s a good idea to go short

Up to this point in the article I have really focused on going long or buying a stock, but the flip side to this equation is the idea of shorting the market to make money as a stock loses value.

Shorting at Resistance

What better place to enter a short position then at resistance.  Think about it, the upside risk is limited as the stock has reached its upward boundaries.  If you are wrong you will immediately know as the stock should retreat at key resistance levels.

Some general rules of thumb for going are:

  1. A stock is below its 200-day moving average
  2. A stock is below its 30-week moving average
  3. The stock has set 3 consecutive lower lows and lower highs
  4. 50-day moving average crosses below the stock’s 200-day moving average.

Flipping from Long to Short

One option is to wait for the stock to approach these resistance levels and open a short position.  Another option (which I have yet to master), is to take a winning long position, close it out and then open a short position for the ride down.

For some reason it’s hard for me to flip between short and long positions on the same stock on the same day for swing trades.  This however does not mean it couldn’t work out for you.

Don’t get caught in the crosshairs of the bulls

In the above example with XOMA let’s assume you decided to take a short position in December, which on the surface would have made perfect sense.  Now, notice how the stock hit this key level and then abruptly pulled back.  At this point you would have felt like you were in complete control of the trade.  However, notice how XOMA quickly picked up steam again and then took a run another run at the resistance level.

Breaking through Resistance

This should be a clear red flag to you that the resistance level would likely fail under the pressure from the bulls.  Sure enough, XOMA sliced through this level with ease and almost made a 100% run.

In this situation, there is no point in fighting the bulls or trying to prove that you are right.  Unlike long positions where you can only lose what you put in, short trades in theory can go against you with no ceiling on the pain you can feel.  This is why it’s very important to monitor your short trades and when faced with a trade like XOMA, exit before long lasting damage is done to your trading account.

Limit the use of Margin when Shorting

The market Gods will allow you to use more money than cash you have on hand, which when used by the right trading professional can be an explosive combination.  However, most traders are not ready for the discipline required to effectively manage a margin account and this fact is most important when shorting.

While the brokerage firm will have stricter rules for shorting, you can still quickly get in over your head if you leverage up too heavily and what looked like the sure beginning of a bear market, becomes a bull’s dream.  Since you have unlimited risk to the upside, your best bet is to use less margin than if you were going long in the market.

Bear markets are generally short-lived as the market has a natural tendency to the upside.  So, while you should look to make money anyway you can, remember that the real money is in going long on margin, not the other way around.

Stop Fighting the Need to Call a Top in the Market

One of the signs of a trader still going through their maturation process is the need to call market tops and bottoms.  While bottoms are hard to call, they generally are a little easier, because markets often fall on fear and then rally as the selling reaches a tipping point. Rallies can go on and on for what seems like years.  Check out the QQQ from 2013 – 2o14 if you think I’m making this up.

What a Bull Market


For most traders, there is often a need to be right and calling a market top is the ultimate manifestation of this trading flaw.

Let me tell you a little secret, the market has no limits.  It can go as high or as low as it likes.  The key thing for you is not to worry about every tick as a stock approaches resistance, but rather use resistance levels as a guidepost of when to go on the defensive.

So, if you have a decent profit in a trade, look to closely monitor the trading performance of the stock at key resistance levels to see if it is in fact time to get off the bus.

Mental Aspect of Selling

Selling requires a completely different part of the brain then buying.  Traders are really good at opening positions, but quite frankly are horrible when it comes to closing out the position. This is because we will believe that our stock is going to go to the moon when in reality we need to be prepared to get off the train much sooner.  The hard thing is that when you sell, for some it means they are giving up hope or they risk losing out on the big move.  The reality is that none of us know what is going to happen, so if you decide to sell you have to be prepared with the idea that the stock could go higher.  This ok and should not be stressed. The big point I’m trying to make here is that you define your exit criteria and you execute that to the letter.  No one ever went broke taking money out of the market.

Good Luck Trading

– Al

Overview of buying a stock at support

Buying a stock or security at support is a tried and tested strategy that has proven to work successfully over the years. This principle is based on the basic laws of supply and demand.

To put it simply, buying at support is the process of identifying when the longs or bulls are perceived to have the upper hand at a specific price point after a weak pullback into a clear support zone.

Not too simple uh?

Now that I have made myself feel super smart, I will spend more time throughout this article assisting you in basics of how to identify support so you can learn to pull the trigger when the opportunity presents itself.

At the end of this article you will know how to:

  1. Place an order to buy a stock
  2. Able to identify optimum buying opportunities
  3. Able to identify when you are wrong in a trade
  4. Know when it is a bad time to buy at support
  5. How much profit to expect per trade

How to actually buy a stock at support

To buy a stock you need to know a few things.

  1. Name of the stock you want to buy.
  2. Price point where you want to enter the trade.
  3. Need to know if you plan on entering a limit or market order.
  4. Number of Shares you plan on buying.

Below is an example of what a buy order for 1,000 shares of Microsoft would look like in the Tradingsim Platform.

Buying a Stock at Support - Order Entry Bar

It’s really funny when you think about how such a simple action has such great financial implications.  Amazing what you can accomplish in just a few short clicks of a mouse over the Internet.

Why you want to buy a stock at support

There are a multitude of reasons you want to buy a stock at support, but I only need two to drive the message home.

1.  Lowers your risk profile

Trading has very little to do with being right, it’s being right at the right time while also limiting the amount of capital at risk.  By entering a trade at support, you have allowed the market to pullback to a significant level which lowers your risk in two forms: (1) you are buying after a decline so you have already avoided the first wave of selling and (2) you are entering a position at a previous support level which increases the likelihood the stock will hold under pressure.

2.  You need to pick a place to enter trades

I know you may be thinking, well no expletive Sherlock, I of course need to settle on a price before buying the stock.  While this is true and doesn’t sound like rocket science, how you buy stocks must be a repeatable process where you can enter and exit positions without hesitation.  This mental skill is developed over time as you begin to build confidence in yourself and your trading system of choice.

Learning to consistently buy stocks at support will get you in the habit of being patient and waiting for the market to come to you.  It also provides you a clear method for entering trades before you branch out into the endless options that exist to analyze the markets.

How to identify the right support level to buy

There are a number of charting methods; however, the easiest way to identify support levels is to use point and figure charts. I am not going to go into the details of point and figure charts for this article, but basically it is the plotting of x’s and o’s which represent the price movement of a security independent of time. As you look at these charts, the support levels will pop out at you as the congestion zones are super clear.

Below is a point and figure chart of the stock MSFT.  Notice how the stock bounced off support in the $450 region and then make a move up to $570.  It’s really easy to see the support zone due to the congestion of x’s and o’s.

Point and Figure Support Zone

In lieu of a point and figure chart, you can use candlesticks to see where candles are bunched together or big swing points that have served as bounce zones in previous chart action. We will cover a few of these examples of where to buy at support later in this article.

When to know you are wrong

One of the greatest challenges new traders face is knowing when they are wrong in a trade. No matter how clear or strong a previous support zone may have appeared, at the end of the day, you have no idea if the support zone will hold or not. I have seen stocks turn on key levels to the penny, while in other cases the market rips to the downside through these levels as if they never existed.

This is why I am a firm believer that there is no value in getting hung up on finding the exact entry point or beating yourself up if things don’t go exactly as planned after entering a trade. At the end of the day, trading is a game of edges.

You know you are wrong once the stock pushes well beyond your identified support zone. I can anticipate your question of, “well what is well beyond the support zone?”  The answer to this question will be dependent on the time frame (i.e. 1min, 5min, daily), but a general rule of thumb is that you should not exceed the support level with high volume and a price break which invalidates the pattern.

For swing traders this will be a break of 10% or more depending on the volatility of the issue and for day traders 2%-3%, again depending on the volatility of the security this rules of thumb can be greater or less. Once this level of breach has occurred, you need to immediately jump into managing the trade and actively look to limit your losses by exiting the trade after a bounce in your favor.

How to know when support becomes resistance

After you have had a significant breach as previously stated, your so-called friend “support” should now be looked upon as the villain of resistance. The premise here is that the longs put up their best fight, but were unable to “hold the line”. When this occurs there is a contingent of traders that do not place stops in the market (myself included). These traders will see the price break and now move their limit orders to exit the position at the previous support area.

You may be asking yourself, why?  Well, most traders have the need to get out even. We can argue all day around why this is the case (ego, since of getting even with the market, etc.), but the point is we can use this bit of human psychology to our advantage. If we know there are a number of longs that are dying to get out because they were burned, common sense tells us that these traders will likely look to exit their position at their entry point, a.k.a. the support area.

This now means that the area which was previously support becomes stiff resistance to any bullish counter rally.

Not a believer?  Check out the below chart and see for yourself how Angie’s List failed to get through previous support.  From the action in the chart, you can see the longs were dying to get out even.

Stock Failing at Previous Support

When buying at support simply will not work

I don’t care how great you think you are or how easy trading the markets are to you. You will end up losing if you attempt to buy stocks at support when the stock is going through a sell cycle or bear market.

So, to make this general point clear of when to not buy pullbacks, read the below guidelines:

  1. If you are looking at a weekly chart and the stock is below the 30-week moving average, you should not open a long position.
  2. If you see the stock below its 200-day moving average you should not open a long position.
  3. The broad market is in a nasty bear market with very aggressive selling (i.e. the spring of 2014).
  4. The stock has had 3 consecutive swing points with lower highs followed by lower lows

The more of the above 4 points that are true, the harder it will be for you to make money buying at support.

Best time to buy at support

Take the above examples of when not to buy at support and flip them on their head. Again, you can make money buying or selling stocks at any point, but it’s how easy you want your money making experience to be.

Examples of buying at support

I consider myself a visual learner so for me there is nothing like reviewing a chart. In the next two examples, we will cover buying at support. I am going to cover two real-life examples so you can get a feel for what you should be looking for.

Buying the pullback to horizontal support

Buying a Stock at Horizontal Support

The above example is a trade I recently made which was a purchase of CNQR in the $95 dollar range as this was major horizontal support going back the ~5 months.  Notice how CNQR had a nice base there before rallying up over $130.

After I entered the trade, the market proceeded lower during the “spring pullback of 2014” (by the way, I just made that up, pretty catchy).  While the March/April 2014 pullback was not like ’87 or ’00, it still had some bite in her.

So, the question for me now is will CNQR rally from here or am I truly stuck in a losing position?

For you reading this article, the question is really irrelevant, the bottom-line is that you want to identify stocks that are approaching historical support levels and doing so on light volume.  This implies that the selling is overdone and a rally is likely to occur.

Buying the pullback in an uptrend

Buying pullbacks in an uptrend is by far my favorite method for buying a stock at support.  While buying horizontal support zones can be profitable, there is nothing like buying a pullback where the low point is always higher than the previous low point.  In my opinion this increases the likelihood that you will end up on the right side of the trade.

The next chart I did not trade, but I wanted to call out a stock that has been hot as of late – Tesla (TSLA).

Buying a Stock in an Uptrend

TSLA has had one of those runs that even a 3-year old could have turned a profit in 2013.  An example of buying the pullback in an uptrend can be seen in the fall of 2o13.  After a nice run up, TSLA began to settle into a groove of making higher highs and higher lows without much selling pressure.  As you can see from the charting example, if you would have placed your buy order at the support line in September, you easily could have ripped down 15%.

Again folks, this is not rocket science.  You want to identify clear areas of support and use those to your advantage.

How much can you expect to make when you buy at support

You can use a host of complicated systems (Elliott Wave, Point and Figure counting) or oscillators to determine when to exit a trade. The reality of it is while these all work quite effectively, a basic rule of thumb is to look back at the last 3 price swings. If the average swing was 20%, then odds are you are likely to make 20% on your position before a counter rally ensues. Now this again is a very basic approach to ball parking profit potential, but until you are ready to take on more complicated methods, this guiding principle will keep you on the right side of the trade.

Conclusion

I personally buy at support for my swing trading strategy. It’s boring, predictable and also highly profitable.

Only you can determine if this strategy is right for you and your personality. There are some of you that will gravitate towards the breakout trade, because you want the immediate action since the stock is crossing a clear decision point. Others will have the same sentiments as I and will look for the support zone as the right time to buy.

At the end of the day, whatever you do just needs to make money on a consistent basis.

If you are looking to practice trading pullbacks, please take a minute to test drive our trading simulator to get a handle on the markets before investing your hard earned money.

Good luck trading!

– Al

I can honestly attribute the use of point and figure charts as one of the turning points in my trading career.  Earlier on as I studied the works of Richard Wyckoff, point and figure (P&F) charts were a staple of his trading methodology.

As I began to define and refine my own trading systems, I slowly drifted away from P&F for more sexy analysis techniques such as Elliott Wave and candlestick patterns.

I soon realized that while these other analysis methods made me feel sophisticated, it wasn’t adding much in terms of money to my account.  As I continued to refine my trading methodology, oddly enough I landed back where I started – P&F charts.

Across the web you will find a number of articles and books on how to create P&F targets.  However, what I aim to do in this article is to not just give you the mechanics for how to perform a count, but to show you my exact settings for determining a profit target.  I will also provide real-life examples so you can see things in action.

Why perform P&F counts

I am a firm believer that the market will do whatever it wants to.  So, it begs the question, why would I get in the business of attempting to predict or guesstimate where the market is headed?

The simple answer to this question is that I seek to understand how far a stock can run for the basis of calculating my risk versus reward for every trade I take on.  This provides me the means to see before I enter a trade whether the stock fits the criteria of my risk profile.

Where people get in trouble with targets (P&F, Elliott Wave, Gann, etc.) is when the trader begins to believe that the market must conform to his or her analysis.  I have personally seen this lack of flexibility ruin otherwise would be great traders.

Methods for calculating P&F Targets

There are two primary methods for calculating P&F targets: (1) vertical and (2) horizontal.  I will not be covering horizontal counts in this article because over time I have found this method unreliable.

Reason being when you have a significant consolidation range, determining which level and how many boxes to count can be challenging.  While there are methods out there for properly determining which row to count, for me these methods lend themselves to too much subjectivity.

For an example of a horizontal count, below is 1-box P&F chart of the stock Rockwell Medical Technologies, Inc. (RMTI).

One Box Count

Where would you have made your horizontal count?

Now, let’s look at the same chart, but on a 3-point reversal.

Three Point Box Count

I don’t know about you, but that doesn’t give me the warm and fuzzies either.  Now, let’s apply a vertical count to the same 3-point chart instead of horizontal.

We first identify the low of the chart which is $9.49 and we count the next column of x’s.  The next column has a total of 13x’s.  To find the P&F target, we take 13 x 3 (remember we are on a three point chart) which gives us a total of 39.  We then count up 39 boxes from $9.49 to arrive at a price target of $13.86.

With this additional level of clarity, let’s go back and look at the previous chart example to illustrate the count.

P&F Target

Simple as pie right?  I am being facetious, but on some level it really is just that simple.  You find the low or high of a major swing.  You then look to the next column of x’s or o’s and take that count times 3 to get your target from the swing point.

This to me is much simpler than trying to take horizontal P&F counts or worst trying to determine what sub-wave we are in of an Elliott Wave pattern.

My Specific P&F Configuration Settings

Those of you familiar with P&F counts are probably saying to yourself, well great job numbnuts, you managed to explain vertical P&F counts.

You would be right in this statement, so let me take it a step further and give you my exact configuration.

(1)    Number of P&F boxes

  1. As stated earlier in the article, I use a box count of 3 to reduce the level of clutter on the chart.

(2)    Vertical Count

  1. The vertical count reduces the level of subjectivity and provides a clear column of boxes to determine a count.
  2. Vertical counts also reduce the potential for counting too many boxes horizontally, which will produce unrealistic P&F targets.

(3)    Scale

  1. I use the percentage scale and more specifically 1% boxes.  This is a critical factor for nailing the precision of a target.  I previously used the traditional scale, which prescribes a set number of boxes for price levels.  This means that the P&F vertical will increase in fixed increments (.25, .5, 1) until a new high or low is breached ($10, $100) and then the count moves to the next increment level up.

The reason I like percentages, is because it takes into account the price movement at each box levels versus key price levels where the increments increase.  Timeframe

  1. I look at the 30-minute timeframe for my P&F charts.  Intraday P&F charts are not the same really as candlesticks or bar charts.  The charts themselves remove time from the equation, so really all we are doing is capturing more price moves throughout the day, versus using a daily timeframe where only a few price inputs are used to calculate the P&F.  The old school method of using P&F was based on using tick charts, but for the purposes of my analysis, 30-minute gives me the perfect mix of staying close to the price action, without overloading myself with fresh data.

For the most part numbers 1 through 3 should be pretty common; however, number 4 is where I separate myself from the pack.  The key inputs of using a scaling method of percentages and the timeframe of 30 minutes will provide you a level of clarity on the market similar to the first time you put on a pair of glasses (assuming you own a pair).

Real-life examples

Now that we have covered how to develop P&F counts in theory, let’s look at some real-life examples.

RMTI Long Position

Going back to the RMTI position, I entered the trade at $10.17 on 2/5/2014.  From there, RMTI went flat for a period of time working through its consolidation phase.  Once the stock began to take off, I knew that all roads would point to ~$13.86 based on the P&F count.

Below is a chart of how the price action ultimately played out.

RMTI P&F Price Target

I was able to close the stock out slightly below the P&F target for a 30+% gain on 2/14/2014.

I use to worry about why things happened and needed to know every single detail.  I have reached a maturity level now where frankly I no longer care.  Call it luck; call it divine intervention, P&F targets simply work.

I shouldn’t be so flipid; P&F targets are the result of the battle between supply and demand at key congestion zones.  Once the price is able to leave these consolidation formations, the box count provides the resulting target for the move.

HWAY Short Position

HWAY took me for a bit of a ride.  I placed the short trade on 12/26/2013.  Looking back I was hungry for action while I was on vacation and I had no business placing the trade as the market was in full holiday mode.

Needless to say, HWAY went well above my entry point of $15.43 and drifted north of $17.  This process of letting HWAY tire out the longs would have been unbearable if it weren’t for my trusty P&F count.

One little ace up my sleeve was the P&F target for HWAY was $16.91.  Please see the count in the below chart:

HWAY P&F Price Target

So, you may be asking how did I know $16.91 was the target?  I knew this for a couple of reasons:

(1)    The P&F target from the $13.05 low was met ($15.93), so the next target would be the count coming out of the trading range.

(2)    $14.71 was the low of the consolidation range.  From this low there was a 5-box vertical count on a three point chart up to $16.91.

I knew with a high degree of confidence that HWAY would face significant resistance at $16.91.  As you can see from the chart, HWAY actually exceeded the P&F count slightly, only to later rollover.

HWAY Price Rollover

Without knowing the potential reversal zone at $16.91, I would have had a tough time sitting through the position as the stock initially moved against me.

Pros of P&F Counts

  • Provides you a roadmap for where a market or stock is likely headed.
  • Serves as an alert to pay closer attention to your positions as key levels are hit.
  • Helps determine risk reward parameters.

Cons of P&F Counts

  • The counts are “targets”, remember the market can always go higher or lower.
  • When determining counts, look back to see how closely a stock has met these target levels.  If the stock has overshot targets in the past, it will likely do so in the future.
  • You have to control the urge to find counts on multiple timeframes.  This will cause analysis paralysis to set in.  Just use one timeframe to ensure you do not cloud the technical picture.

In Conclusion

The P&F settings discussed in this article are specific to my swing trading system.  By using these settings I am able to achieve anywhere from 10% – 40% gains when taking into account my trade management strategy which calls for me to let my winners run.

As you explore the possibility of using P&F charts to determine price targets you will want to take the following into account:

(1)    Are you swing trading, day trading or long-term investing?

(2)    What is the volatility of the stocks you are trading?  This will directly impact the validity of the P&F targets.

Continue to tweak your P& parameters until you find a system that gives you the most profit on every trade.