Three White Soldiers: 3 Things You Must Consider Before Trading [Video]
Tag: day trading
The Three White Soldiers pattern is a popular bullish candlestick pattern. It is fairly easy for most traders to spot in real time given the 3 large range successive candles. Moreover, in the right context it can signal a reversal of a trend. In this post we’ll discuss the context, requirements, and a free video on how to trade this pattern.
Our in house trading expert, Al Hill has put together a quick video explaining the pattern. Have a look before you get started with the tutorial.
Overview
The three white soldiers is a Japanese candlestick pattern that is comprised of three or more bullish candles. [1]
The candles are white because positive price movement in eastern technical analysis is represented white and not green (as most charting platforms default to these days).
The reference to soldiers is in the context of the battle between the bulls and bears. Visually, they are marching forward with no impediment.
Three White Soldiers
3 Requirements for Confirmation
Now that you have the image of the three white soldiers candlestick pattern in your mind, hopefully you’ll begin to see the pattern on your charts more often. Sometimes studying candlestick patterns can be a lot like listening to a new song, it gets stuck in your mind.
But not every sighting of a pattern is tradeable.
With most candlestick patterns, one trader may see a bullish setup, while another may see bearish signs. For this reason, it is imperative to qualify the context of the candlestick patterns before making a trade.
Next, we will dive into three clear requirements you should look for when the candles present themselves on the chart.
1st Requirement – Three Bullish Broad-Range Candles
The first rule for the pattern is that you need clean candles with decent size. By clean, we mean without a lot of selling pressure. Ideally, you don’t want long upper or lower wicks.
These candles all need to finish in the positive and the candles cannot breach the low of the prior candlestick. For reference, please see the above image.
Next, the candles need to be healthy in size, where the open is essentially the low of the period and the candlestick closes near its high. The price advancement for each candle should be considerable compared to other candles on the chart
We aren’t looking at a doji or narrow body candle here.
In the right context, this suggests ease of upward movement. A bullish sign.
2nd Requirement – Formation at the End of a Bearish Move
This requirement is a bit more subjective and tougher to identify. You essentially need to identify weakness in a stock and then the three white soldiers show up to the rescue.
Contextually, it can come when there is a lack of supply in the market after a heavy sell off, signaling a big reversal. Short covering can fuel the Three White Soldiers off the lows.
This can occur after a clear bear trend down or after a stock retreats to the bottom of a trading range.
3rd Requirement – Heavy Volume Signature
This one is not discussed as often, but you need to see volume in the setup to validate its strength. [2] If you encounter three white soldiers that are on light volume this could mean there was a handful of weak retail traders that jumped in too soon.
Without volume this pattern has a higher probability of rolling over, thus stopping you out of your position.
Three White Soldiers Chart – Example 1
Weak Three White Soldiers
In the first chart example, we’re reviewing the symbol SBAC. One of the first interesting points is that the stock has a sharp move upward at the open and then immediately rolls over.
Out of this weakness, SBAC then prints Three White Soldiers. This was an indication that the weakness had subsided and the stock would then attempt to develop some sort of base.
The one issue with this particular setup is the volume. As we stated earlier, the volume must accompany the setup in order for the signal to carry real weight.
The light volume in the Three White Soldiers pattern for SBAC did not ruin the trade as the stock was able to make a run for the daily highs.
However, the stock topped out at that point and developed a range.
So, in this example, while SBAC did not roll over, the stock also did not make the sizeable move we would have hoped for with this setup.
Three White Soldiers Chart – Example 2
Weak Three White Soldiers
In this example, do you see how MTN sold off the entire day? The stock had a high volume down event followed by three white soldiers. Yet again, the volume did not follow through with the soldiers.
So, what happened next?
The stock had a minor pop back up to the downtrend line only to drag lower into the close.
Are you starting to see a trend with weak volume?
That’s right, sometimes the soldiers may print on the chart, but these are not always your front line heroes.
Three White Soldiers Chart – Example 3
Now that the failed examples are out of the way (it is always good to have a healthy does of skepticism with any pattern), let’s turn our attention to a Three White Soldiers formation that works out nicely.
Clean Three White Soldiers
After a steep selloff into a support zone, DK prints three white soldiers with decent volume and the stock shot back up to the most recent swing high.
Three White Soldiers Chart – Example 4
We’ll save the best for last. In this example, EYES is trending upward from a consolidation in the morning. Now that it is above its prior resistance, we get a little pullback in the price action — just enough to suck shorts into the trade.
EYES Three White Soldier
Once shorts are getting nice and cozy, bulls come with a vengeance to reclaim their trend.
Like the other examples, note the massive volume signature on these Three White Soldiers marching to new highs.
This particular stock ran another 400% from this point. So you can see that context is everything.
Why The Three White Soldiers Candlestick Pattern Is Difficult To Trade
Everything you have read on the internet probably praises this formation and the power of its trend forecasting capabilities. And it can be a great pattern for that reason, no doubt.
However, depending on your trading style, you may find this pattern difficult to trade for a few reasons shared below.
1. Difficulty Buying Selloffs
Many traders do not like to buy selloffs or stocks floating lower. You may have heard of the old adage, “don’t try to catch a falling knife?” Well, this is no different.
Trying to time the bottom can be difficult and risky, you never know when the stock could flush lower, stopping you out. Or even worse, stopping you out with a horrible fill.
2. Risk Is Too Wide
The difficulty with buying the Three White Soldiers is that they are very wide bodied candles. As you notice from the examples above, waiting for the last soldier to form may create an emotional hurdle if you plan to set your risk at the low of the day.
If you were to buy three white soldiers at the confirmation of the last candle, that’s three really large candles to set a stop against. It’s simply too much risk in the trade relative to the profit potential on the upside.
As a consolation, if the pattern is extremely bullish with accompanying volume, you might decide to put your stop at the low of the last soldier candle. This could be a work around for the risk issue.
Otherwise, you might wait for a pull back to retest the demand in these three candles and take your long position there.
3. Buying The Pullback May Not Work
Those of you familiar with the setup will say, “well, duh, don’t buy the break of the third candle.” As mentioned above, you could just wait for a slight pullback on light volume after the three white soldiers develops.
Perhaps buy a 50% retracement from the high of the pattern, if you get that.
This doesn’t always work. As you can see with the EYES example above, we never got that retest.
However, the silver lining in the EYES example is that we did retest the high of the third soldier candle two times, and both times held the new trend well.
EYES holds support at the Three White Soldiers
Again, the key is context and the ability to set risk according to the potential profit you might make in the trade.
An Alternative Buy Point
Experienced traders prefer their patterns to start and move with a sense of urgency. For this reason, you could initiate a position into the runup of the three white soldiers, adding as volume confirms.
This is more of an anticipatory strategy if you sense heavy demand in the tape or Level II. After the completion of the formation you can make a decision to add or cut the trade depending on the context.
How To Practice the Three White Soldiers
If you are contemplating trading the three white soldiers pattern you can practice identifying the setup within a simulator by replaying tick data for over 11,000 symbols for the last 3 years.
You can then work on developing your own specific rules for entries, stops, and targets.
As always, be sure to ask yourself the following questions when practicing any setup:
what qualities work for each particular setup
what criteria were met, or not met
how was volume associated with the pattern
where could you have set your risk and profit target
how many of your trades worked or didn’t work
For more information on candlestick patterns, please check out our free technical analysis section devoted to these great trading tools.
Recently, we discussed the general history of candlesticks and their patterns in a prior post. We also have a great tutorial on the most reliable bullish patterns. But for today, we’re going to dig deeper, and more practical, explaining 8 bearish candlestick patterns every day trader should know.
We’ll cover the following:
What these patterns look like
The criteria for confirming them
The story these candles tell
How to set entries and risk for each
Some common mistakes when interpreting them.
Also, feel free to use our quick reference guide below for bearish candlestick patterns! Be sure to save the image for your use with your trading and training in the market!
What Bearish Candlesticks Tell Us
Hopefully at this point in your trading career you’ve come to know that candlesticks are important. Not only do they provide a visual representation of price on a chart, but they tell a story.
Behind this story is the belief that the chart tells us everything we need to know: the what being more important than the why. Each candlestick is a representation of buyers and sellers and their emotions, regardless of the underlying “value” of the stock.
Bearish candlestick patterns typically tell us an exhaustion story — where bulls are giving up and bears are taking over. Many of these are reversal patterns.
Check out or cheat sheet below and feel free to use it for your training!
Without further ado, let’s dive into the 8 bearish candlestick patterns you need to know for day trading!
1. The Shooting Star
In case you were wondering, the names of candlestick patterns usually describe a visual representation to something in real life. The Japanese were fond of naming them that way.
The shooting star is no exception.
When it occurs, it will be at the height of a current uptrend — typically an extended trend.
It’s a lot like a shooting star falling from the heights of the heavens.
At the end of that trend, the stock experiences one last effort to push higher, only to reverse on itself. Hence the name, shooting star.
It goes up, only to fall back.
Entry
Where would you enter?
More aggressive traders may anticipate the reversal as the candle is forming. Otherwise, you can wait until the close of the shooting star, enter, and set your stop at the high of the shooting star candle.
Shooting Star Example
AMC provides a great example of this pattern during a recent intraday session. Notice that the trend was clearly upward and becoming extended. The stock makes a climactic push to new highs, then reverses on increased volume.
AMC with a fantastic example of a Shooting Star
Also, notice that the second reversal candle beyond the shooting star. It retraces slightly into the wick of the shooting star. This is a great example of why your stops/risk need not be too close, or wait for entry on the second candle.
This reversal pattern can be seen in different contexts. It can occur off the open, or in an extended uptrend.
The thesis behind the pattern points to strong supply levels that completely surpass the effort of bulls to push a stock upwards. The result: the price opens above the preceding candle, then commences to sell off forcefully.
The body of the candle completely “engulfs” the prior candle, and should close below it.
Entry
There can be a few discretionary entries on this pattern depending on experience. Aggressive traders may choose to enter as the candle is forming, if supply is clearly visible. This is more of an anticipatory entry.
If trading “by the book”, you may want to wait until the new low is confirmed, then enter on the next candle.
Ideally, you want to trade in either the direction of the larger trend, or enter as an overextended trend reversal.
Set your stop in the body of the candle or at the high of the candle depending on its range.
Bearish Engulfing Examples
FCEL is a perfect example of this bearish candlestick pattern on the 5-min chart. Notice that the stock is trending downward from the pre-market. It is also struggling with VWAP, the red indicator line on the chart below.
FCEL with an opening range breakdown and Bearish Engulfing Crack
Off the open, the stock tries to push higher, but we notice some selling pressure in the upper wick of that first green 5-minute candle. The price then moves lower, engulfing that candle with ease of movement to the downside.
BA provides us with another look at this bearish candlestick pattern in a different context.
BA with an overextended bearish engulfing candle
Notice the reversal from an extended intraday run here. Just like the example above, the 5-minute candle completely engulfs the prior candle. This time, it is with increasing volume.
What does that tells us?
Think in terms of effort vs. result. The effort (volume) increased and the result (price) was a complete retracement downward (link to effort/result).
This gives us the confidence to go short, risking toward the highs.
3. Bullish Engulfing Sandwich
Do not be confused by the name. This is also called a “stick sandwich”. It is not a bullish pattern in this particular scenario.
The point here is that the “bullish” engulfing candle in the middle of the pattern is “sandwiched” by bearish candles.
In this instance, it takes more than a single supply candle to overcome the demand. It takes three or four candles for the pattern to confirm.
First, you have what appears to be a bullish engulfing candle (the opposite of the bearish engulfing candle we just identified above). Then, instead of confirming new highs, the stock reverses again.
Context is everything here. In the example below, you’ll see that the general trend is downward. For this reason, the bullish engulfing sandwich can be thought of as a continuation pattern.
Entry
Entry is on confirmation of a breakdown — lower lows on the reversal candle. Stops can be set in the body of the candles above.
Bullish Engulfing Sandwich Example
FUBO provides a fantastic opportunity to see this bearish candlestick pattern in action right at the opening of the market.
FUBO intraday Bullish Engulfing Sandwich pattern
Notice that the trend is downward from the premarket. It was also continuing downward from the day before.
The stock stalls at vwap, struggling. It tries to reverse, but notice the volume on the green reversal candle. It is no match for the supply in the first 5-minute candle of the day.
The effort in that first candle dwarfs the efforts of the bulls.
The stock then reclaims vwap, its downward trajectory, and the bulls submit to the bears one more time.
Learn more about this bearish pattern and it’s bullish counterpart in our blog post covering the Stick Sandwich.
4. The Evening Star
We’ve included the Evening Star with the Evening Doji Star because they are very similar, both in style and in context.
Each are bearish candlestick patterns.
Leading into the star, you’ll need to spot a wide bodied candle. The star itself is the narrow body indecision candle that follows the upward wide-body candle.
Entry
The confirmation comes with the breakdown on the longer bodied bearish candle. A great place to enter, risking off the highs of the doji candle.
This pattern works particular well at the high of the day as a trend reversal. But it can also be a trend continuation pattern if it appears at the top of a short-lived rally into prior resistance.
Evening Star Example
In this intraday example with GME, we notice that the upward trend has been strong. For the first hour+ of the morning, there have been few, if any pullbacks.
GME with an evening star pattern playing out intraday
However, we notice some selling pressure coming on this 5-minute chart just before 10:30am. Typically we might have played that as a shooting star, but we never got the breakdown confirmation with a close below the body of that candle.
Despite the failed breakdown on the shooting star, it is a warning sign that supply is coming into the market.
The alert trader keeping his/her eyes open for any signs of reversal on this overextended stock would notice the Evening Star forming on increasing volume. Again, the effort (volume) is there, but the result (price) is a small doji candle.
How can we interpret this?
It is likely that there is plenty of profit taking going into this GME Evening Star candle as FOMO (fear of missing out) retail buyers chase the stock higher. Strong hands are taking the opportunity to sell their shares.
This gives the attentive trader an opportunity to capitalize by going short.
5. Tweezer Top
The tweezer top is yet another reversal pattern or continuation pattern.
The 1st element is the wide body bullish candle signaling potential exhaustion in an uptrend. This is followed by weak or no effort to continue higher, hence the reversal.
Ideally, volume is increasing during both of these candles as supply is added to the market as weak hands are tempted to continue buying here.
As a bearish pattern, the two candles should share roughtly the same high if possible.
Entry
Entry can be made on a close below the reversal candle with a stop set at the high.
Tweezer Top Example
Take a look at this AMC tweezer top. Can you see the green and red candles providing the proper representation of the two sides of a pair of tweezers?
AMC putting in a tweezer top pattern intraday
Depending on the range of the candles, you can enter aggressively as the tweezer is forming, especially if supply appears heavy.
Otherwise, you can wait until the candle closes for your entry and set a stop at the high of day, or in the body of the tweezer top. This is discretionary depending on the risk/reward you are looking for, as well as your risk personality and position size.
As you can see from the chart, often times vwap can be a great target area (red line).
6. Dark Cloud Cover
Dark Cloud Cover is the opposite of a bullish reversal pattern called Piercing Line. For the bearish pattern, it must first have a solid green or white bar continuing the uptrend.
After the bullish candle closes, we expect to see another candle try to make new highs. This new candle fails, then closes more than midway into the body of the 1st candle. Hence, the overhead supply is called “dark cloud cover.”
One of the best ways to play this pattern is in an overall downtrend during a short term reversal. As the stock tries to rally into resistance, you can anticipate the end of the rally.
Entry
Positions should be entered as the stock breaks the prior bar with stops set at the high of the candle.
Dark Cloud Cover Example
Occasionally the market gifts us with a nice double top failure in an overall downtrend. RIOT gave us this opportunity intraday recently as it pulled back from the morning lows, only to find resistance at vwap.
RIOT forming a double top with bearish Dark Cloud Cover candlestick pattern
As you can see, RIOT was struggling to overcome vwap on heavy volume the first try. The second try gave us a beautiful confirmation with the Dark Cloud Cover pattern.
7. Shrinking Candles
Shrinking candles are a classic example of effort vs result. It is a bearish reversal candlestick pattern usually accompanied by a huge volume signature below.
The understanding is that the amount of effort to push the stock to new highs is increasing. However, the result is decreasing.
How do we interpret this?
Given the context, it should imply that a considerable amount of selling pressure is adding to the volume as price moves sluggishly upward. This selling pressure is counteracting the demand.
Why else would the candles be shrinking?
Once bulls realize this, it is often too late. Without proper buying underneath, the result can be devastating for long chasers wrongly assuming there is upward momentum.
In essence, there is no synchronicity between volume and price. They are at odds with each other on the way up. An anomaly, if you will.
Shrinking Candles Example
Here is real example from the 5-minute chart of BTBT. As you study this chart, pay close attention to the volume and how it corresponds with each candle.
BTBT displaying a Shrinking Candles pattern intraday
As you can see, the largest amount of volume comes as BTBT tries to rally above the pre-market highs. As it does, the candles begin to shrink.
Momentum is being lost as gravity, supply in this case, strangles this rocket off the morning lows. Strong hands take advantage of morning break out buyers, who are left holding the bags as the stock fades the rest of the day.
Entry
As you look at the chart, hopefully you can pinpoint a great short entry as the last green candle is broken to the downside. The double top is clear, and a close risk/stop can be set at the highs.
8. Hanging Man
Hanging Man is very similar visually to the Hammer pattern. The Hammer is usually bullish at the end of a down trend. However, the Hanging Man is a bearish candlestick pattern at the end of an uptrend.
Selling pressure is the key to recognizing this pattern.
Inside the formation of the candle, there is considerable selling pressure to begin with.
The close at the highs can be misleading in that the selling pressure is mostly overcome as it rallies.
Often times this results in an opportunity to trap longs who may believe the supply was overcome by demand.
However, the supply is still present.
If longs who bought on the way back up are overcome on the next candle, they are likely trapped from their entries and will add to the selling pressure as the stock capitulates.
Hanging Man Example
Check this beautiful uptrend on the recent intraday chart of PLUG. It appears there is nothing to stop the upward momentum. That is, until we get the Hanging Man, signaling the top for us.
PLUG 5-minute chart displaying a Hanging Man reversal pattern
Entry
Ideally the next candle after the close of the Hanging Man would provide the nearest risk/reward entry at the top.
If you aren’t fast enough to enter on the close of the Hanging Man and risk to the highs, it does offer a right shoulder for entry later.
How To Practice Candlestick Patterns
So there we have 8 of the most common bearish candlestick patterns. Now you’re probably wondering how to spot them in real time.
We do have a handful of quick reference guides. These can be a great resource in the moment if you are unsure.
However, learning the context of these patterns is paramount. Otherwise, you may find yourself trading them without proper confirmation. It takes time and experience.
How do you speed up the learning curve?
There is no better way to rapidly increase your exposure to these patterns than in a simulator.
Imagine being able to replay the market for any particular day up to three years in the past. You can do it in your spare time.
Pick a day, pick a pattern, pull up the scanner, and take notes every time you see the pattern play out well.
As you practice, ask yourself these questions:
Where did the pattern occur in a trend?
Did the pattern confirm?
How was volume associated with the confirmation of the pattern?
Would the risk/reward have been worth it for the trade?
Conclusion
We hope you’ll find this lesson a beneficial tool in your short-trading-strategy belt. Nothing beats the ability to read charts well and bearish candlestick patterns are an integral part to that process.
Today we will dive deep into the significance of Pivot Points for day trading. When you finish reading this article, you will understand the 5 reasons why day traders love using them for entering and exiting positions, and how you can employ them as a part of your overall trading plan.
Feel free to watch our free tutorial on Pivot Points by in-house daytrading expert, Al Hill. Al is a 20-year trading veteran.
What Are Pivot Points
As a technical analysis indicator, a pivot point uses a previous period’s high, low, and close price for a specific period to define future support. In addition, other small calculations determine the “outside” points.
Together, these can determine the bounds of a stock price over different time periodsgiving traders an edge on the market.
7 Pivot Point Levels Explained
There are seven basic pivot levels on the chart:
7 key Pivot Points explained
History of Pivot Points
Pivot points were originally used by floor traders on stock exchanges. They used the high, low, and close prices of the previous day to calculate a pivot point for the current trading day.
This calculation helped them notice important levels throughout the trading day. Pivot points have predictive qualities, so they are considered leading indicators to traders.
The main pivot point is the most important price level for the day. Essentially, it represents the balance between bullish and bearish forces.
In other words, when prices are above the pivot point, the stock market is considered bullish. If prices fall below the pivot point, the market is considered bearish.
While pivot points were originally used by floor traders, they’re now used by many retail traders, especially in equities and forex.
5 Reasons Why Day Traders Love Pivot Points
1) Unique for Day Trading
The pivot points formula takes data from the previous trading day and applies it to the current trading day. In this manner, the levels you are looking at are applicable only to the current trading day. This makes the pivot points the ultimate unique indicator for day trading.
2) Short Time Frames
Since the pivot points data is from a single trading day, the indicator can only be applied to shorter time frames. The daily and the 30-minute chart will not work, because it will show only one or two candles.
The best timeframes for the pivot point indicator are 1-minute, 2-minute, 5-minute, and 15-minute. Hence, its use for day traders.
3) High Accuracy
The pivot point indicator is one of the most accurate trading tools. The reason for this is that the indicator is used by many day traders, professional and retail alike.
This will allow you to trade with confidence and the flow of the market.
4) Rich Set of Data
Pivot points on charts provide a rich set of data. As we discussed above, the indicator gives seven separate trading levels. This is definitely enough to take a day trader through the trading session.
5) Easy to Use
The PP indicator is an easy-to-use trading tool. Most of the trading platforms offer this type of indicator. This means that you are not required to calculate the separate levels; in fact, the Tradingsim platform will do this for you. Your only job will then be to trade the bounces and the breakouts of the indicator.
Pivot Point Calculation
Daily pivot points are calculated based on the high, low, and close of the previous trading session.
When you add the seven pivot levels, you will see 7 parallel horizontal lines on the chart.
Pivot Points
The above chart is zoomed out in order to show all 7 pivot levels.
Let’s now discuss the way each of the seven pivot points is calculated. First, we need to start with calculating the basic pivot level (PP)– the middle line.
PP Calculation
Below is the formula [1] you should use to determine the PP level on your chart:
Pivot Point (PP) = (Prior Daily High + Low + Close) / 3
R1 R2 S1 S2 Pivot Levels Calculation
Now that we know how to calculate the PP level, let’s proceed with calculating the R1, R2, S1, and S2 pivot levels:
R1 = (2 x Pivot Point) – Prior Daily Low
R2 = Pivot Point + (Prior Daily High – Prior Daily Low)
S1 = (2 x Pivot Point) – Prior Daily High
S2 = Pivot Point – (Prior Daily High – Prior Daily Low)
R3 S3 Pivot Levels Calculation
We are almost done with the pivot point calculation. There are two more levels to go – R3 and S3.
R3 = Daily High + 2 x (Pivot Point – Prior Daily Low)
S3 = Daily Low – 2 x (Prior Daily High – Pivot Point)
See that the formulas for R1, R2, R3, S1, S2, and S3 all include the PP value.
This is why the basic pivot level is crucial for the overall pivot point formula. Therefore, you should be very careful when calculating the PP level. After all, if you incorrectly calculate the PP value, your remaining calculations will be off.
Pivot Points 2
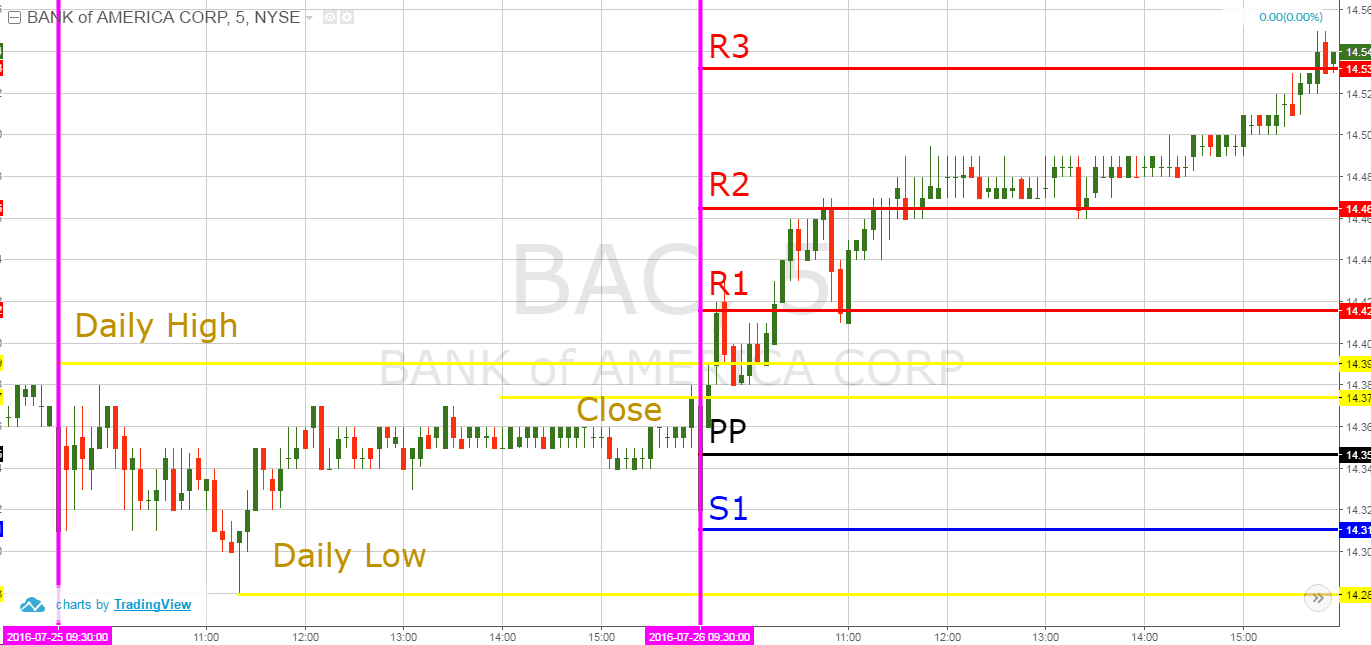
You are now looking at a chart, which takes two trading days. Each trading day is separated by the pink vertical lines. We use the first trading session to attain the daily low, daily high, and close.
Daily High = 14.39
Daily Low = 14.28
Close = 14.37
Then we apply the three values in the formulas above, and we get the following results:
PP = 14.35
R1 = 14.42
R2 = 14.46
R3 = 14.53
S1 = 14.31
S2 = 14.24 (not visible)
S3 = 14.20 (not visible)
5 Different Kinds of Pivot Points
Here are five types of the most popular pivot points.
1. Standard pivot points
Standard pivot points are the most basic pivot points that day traders can calculate. First, traders start with a base pivot point. That’s the average of the high, low, and close from a previous period.
Below is the complete calculation for standard pivot points.
To calculate the Base Pivot Point:
(P) = (High + Low + Close)/3 calculate the First Support Level: Support 1 (S1) = (P x 2) – High
When calculating the Second Support Point:
Support 2 (S2) = P – (High – Low)
To calculate the First Resistance Level:
Resistance 1 (R1) = (P x 2) – Low
When calculating the Second Resistance Level:
Resistance 2 (R2) = P + (High – Low)
2. Fibonacci Pivot Points (The Most Popular)
The Fibonacci pivot point is perhaps the most popular among traders.
Fibonacci extensions, retracements, and projections are commonly used in forex, but are used with equities as well. The Fibonacci retracement levels are named after a mathematical sequence.
Ken Ribet is professor of mathematics at the University of California, Berkeley. He points out that a Fibonacci number started out having a simple formula.
“A lot of things in mathematics and probably in the real world are governed by simple recursive rules, where each occurrence is governed by a simple formula in terms of the previous occurrence. And a Fibonacci number has the simplest possible formula, just the sum of the previous two.”
In the her speech, Stockton points out that Fibonacci levels can become so “widely followed level that…there becomes some self-fulfilling property to it.”
Here is the calculation for the Fibonacci pivot point.
To calculate the Base Pivot Point:
Pivot Point (P) = (High + Low + Close)/3
When calculating the First Support Level:
Support 1 (S1) = P – {.382 * (High – Low)}
To calculate the Second Support Level:
Support 2 (S2) = P – {.618 * (High – Low)}
When calculating the First Resistance Level:
Resistance 1 (R1) = P + {.382 * (High – Low)}
To calculate the Second Resistance Level:
Resistance 2 (R2) = P + {.618 * (High – Low)}
When calculating the Third Resistance Level:
Resistance 3 (R3) = P + {1 * (High – Low)}
3. Woodie’s Pivot Point
Woodie’s pivot points place more weight on the closing price. However, the calculation is similar to the standard pivots formula.
The calculation is as follows:
R2 = PP + (High – Low)
R1 = (2 X PP) – Low
PP = (High + Low) + (2 x Closing Price) / 4
S1 = (2 X PP) – High
S2 = PP – (High + Low)
4. Camarilla Pivot Points
Another pivot point that traders use are Camarilla pivot points. Nick Scott invented the Camarilla pivot point in the 1980s.
It’s similar to the Woodie’s pivot point. However, there are four resistance levels and four support levels. In contrast, the Woodie pivot point has two Resistance levels and two Support levels.
This is the calculation for the Camarilla pivot point:
R4 = Closing + ((High -Low) x 1.5000)
R3 = Closing + ((High -Low) x 1.2500)
R2 = Closing + ((High -Low) x 1.1666)
R1 = Closing + ((High -Low x 1.0833)
PP = (High + Low + Closing) / 3
S1 = Closing – ((High -Low) x 1.0833)
S2 = Closing – ((High -Low) x 1.1666)
S3 = Closing – ((High -Low) x 1.2500)
S4 = Closing – ((High-Low) x 1.5000)
5. Demark Pivot Points
Demark pivot points have a different relationship between the opening and closing prices. Noted trader Tom Demark introduced this version.
The Demark pivot point uses the number X to calculate the lower level line and the upper resistance level. It also emphasizes recent price action. The calculation is as follows:
If Close > Open, then X = (2 x High) + Low + Close
If Close < Open, then X = High + (2 x Low) + Close
If Close = Open, then X = High + Low + (2 x Close)
Pivot Point = X/4
Resistance 1 = X/2 – Low
Support 1 = X/2 – High
How to Draw the Pivot Point Stock Market Indicator
The pivot point stock market indicator should be applied to the chart as follows:
PP level
R1 and S1
R2 and S2
R3 and S3
When you follow this order there is a small chance that you might mistakenly tag each level. To avoid this potential confusion, you will want to color-code the levels differently.
For example, you can always color the PP level black. Then the R1, R2, and R3 levels could be colored in red, and S1, S2, and S3 could be colored in blue. This way you will have a clear idea of the PP location as a border between the support and the resistance pivot levels.
Thankfully, these days many charting platforms have a built-in pivot point indicator. This means that the indicator could be automatically calculated and applied on your chart with only one click of the mouse.
This will definitely save you a ton of time.
How Pivot Points Work
Pivot points provide a standard support and resistance function [2] on the price chart.
When price action reaches a pivot level it could be:
Supported/Resisted
Extended (breakouts)
All things considered, if you see the price action approaching a pivot point on the chart, you should treat the situation as a normal trading level. Nonetheless, if the price starts hesitating when reaching this level and suddenly bounces in the opposite direction, you might then trade in the direction of the bounce.
However, if the price action breaks through a pivot, then we should expect the action to continue in the direction of the breakout. This is called a pivot point breakout.
Day Trading with Pivot Points
Now that we understand the basic structure of pivot points, let’s now review two basic trading strategies – pivot level breakouts and pivot point bounces.
1. Pivot Point Breakout Trading
To enter a pivot point breakout trade, you should open a position using a stop limit order when the price breaks through a pivot point level. These breakouts will mostly occur in the morning.
If the breakout is bearish, then you should initiate a short trade. If the breakout is bullish, then the trade should be long.
Always use a stop loss when trading pivot point breakouts.
A good place for your stop would be a top/bottom which is located somewhere before the breakout. This way your trade will always be secured against unexpected price moves.
You should hold your pivot point breakout trade at least until the price action reaches the next pivot level.
How it works:
Pivot Point Breakout Strategy
This is the 5-minute chart of Bank of America from July 25-26, 2016. The image illustrates bullish trades taken based on our pivot point breakout trading strategy.
The first trade is highlighted in the first red circle on the chart when BAC breaks the R1 level. We go long and we place a stop loss order below the previous bottom below the R1 pivot point. As you see, the price increases rapidly afterwards.
For this reason, we hold the trade until the price action reaches the next pivot point on the chart. When this happens, the price creates a couple of swing bounces from R2 and R1.
After bouncing from R1, the price increases and breaks through R2. This creates another long signal on the chart. Therefore, we buy BAC again.
There is a long lower candlewick below R2, which looks like a good place for our stop loss order.
The price then begins hesitating above the R2 level. In the last hours of the trading session, BAC increases again and reaches R3 before the end of the session.
This is an exit signal and we close our trade.
2. Pivot Point Bounce Trading
This is another pivot point trading approach. Instead of buying breakouts, in this pivot point trading strategy we emphasize the examples when the price action bounces from the pivot levels.
If the stock is testing a pivot line from the upper side and bounces upwards, then you should buy that stock.
Conversely, if the price is testing a pivot line from the lower side and bounces downwards, then you should short the security.
As usual, the stop loss order for this trade should be located above the pivot level if you are short and below if you are long.
To be clear, pivot point bounce trades should be held at least until the price action reaches the next level on the chart.
How it works:
Pivot Point Bounce Strategy
Above is a 5-minute chart of the Ford Motor Co. The image shows a couple of pivot point bounce trades taken according to our strategy.
Our pivot point analysis shows that the first trade starts 5 periods after the market opening. The price goes above R2 at the opening bell. Then we see a decrease in supply and a bounce from the R2 level. This creates a long signal on the chart and we buy Ford placing a stop loss order below the R2 level.
Immediately following, the price enters a bullish trend. Because of this, we stay with the trade until Ford touches the R3 level.
At this point, we close the trade.
However, the price bounces downwards from the R3 level after the second test. This is another pivot point bounce, so we short Ford security as stated in our strategy.
A stop loss order should be placed above the R3 level as shown on the chart.
After a short consolidation and another return and a bounce from the R3 level, the price enters a bearish trend. We hold the short trade until Ford touches the R2 level and creates our exit signal.
5 Common Mistakes when Trading with Pivot Points
Trades that Clear S4 or R4
These are the setups you really want to hone in on.
Think about it, why buy a stock that has resistance overhead. You can just as easily invest in a stock that has the wind to its back and you can ride the wave higher.
If there is no one looking to sell at a pivot point resistance level and there are no swing highs – that equals odds in your favor.
Even when things go wrong, you are still likely to come out even or at least have a fighting chance.
This going with the trend, of course, works just as well with shorts that clear S4 support.
Here is a real example of this pivot point trading strategy with Advanced Auto Parts (AAP).
Pivot Points and Fibonacci Levels
Is there anything different on the chart that you weren’t expecting to see?
If you can’t point it out, it’s the Fibonacci levels in the upper left of the chart.
Fibonacci Levels
Once a stock has cleared all of the daily pivot points, the next thing you need to look for are the overhead Fibonacci extension levels and swing highs from previous moves.
These levels can be used as your target areas for your trades. You can then use these levels to calculate your risk-reward for each trade.
After purchasing the stock on the break of both the pre-market and intra-day high, it’s now about holding on and riding the trend up to the next Fibonacci level at around 261.8% (2.618) retracement.
At this point, you do not want to get greedy. You should always look to clean off your trade slightly below that level.
Try applying these techniques to your charts to identify the levels tracked by professional traders.
Pivot Points and High Float Stocks
Nowadays many gurus are talking about low float, momo stocks that can return big gain. There may be a place for trading those stocks if you are highly experienced and accustomed to volatility and high risk.
However, when it comes to Pivot Points, high float stocks are still in vogue [3].
The beautiful thing about higher float stocks is that these securities will adhere to and trade in and around pivot point levels in a predictable fashion.
If you are a trader just starting out with pivot points and want to get a handle on things, you will want to start with these large-cap stocks. Once you get a handle on things, you can always progress to the penny stocks.
How Pivot Points Help Build Consistency
Do you find yourself obsessing about when to exit your trades. Maybe your entries are solid but you always have sellers remorse.
You either regret getting out too early or holding on too long.
This is something many traders struggle with for years.
To this point, including pivot points in your trading could be like going from the dark and stepping into the light. The beauty of using pivot points is that you have three clear levels:
where to enter the trade
when to exit the trade
how to place your stop
If you are the type of person that has trouble establishing these trading boundaries, pivot points can be a game-changer for you.
To further illustrate this point, check out the below charts
Entry, Exit, StopsEntry, Exit, Stops – 2
Do you see the beauty of the pivot points on the chart?
If you struggle with where to place your stops, entries and profit targets, pivot points take care of all of that for you.
You do not need an expensive trading system or AI program to accomplish this goal.
The other major point to reiterate is that you can quickly eyeball the risk and reward of each trade. Therefore over time, you will inevitably win more than you lose, and the winners will be larger.
This, my friend, is how you build wealth – one trade at a time.
Knowing When You are In a Losing Trade with Pivot Points
If you are going long in a trade on a break of one of the resistance levels and the stock rolls over and retreats below this level – you are likely in a bad spot.
Cannot Hold the Level
This should give you pause for concern when it doesn’t pan out the way you had planned.
This does not mean you need to run for the hills, but it does mean you need to give the right level of attention to price action at this critical point.
Time Lapse
The other point is to consider the amount of time that passes after you have entered your position.
If your position is sitting below or right around the breakout level 30 minutes after entering the trade – the stock is screaming warning signals.
Too Much Time
Do not over think exiting bad trades. If you find yourself in a trade that is stalling or not holding a level, just exit the trade. Waiting around for something to happen can lead to more losses.
Beyond the money, the major issue you will face is the emotional turmoil of tacking such a loss. Remember, do not think – just close the trade!
Pivot Points from Prior Days
Most charting software will allow you to select whether you want to see the current day’s pivot points or if you would like to see pivot points from prior days.
At first glance, it’s easy to want to focus on the current day levels as it provides a clean chart pattern; however, prior days levels can trigger resistance on your chart.
R4 Level Cleared
In the above chart of NANO you can see that the R4 level was cleared. The next question you are likely to ask yourself is where will NANO stop?
Unfortunately, simply looking at the pivot points for one day gives you no way of making that determination.
Multiple Days of Pivot Point Levels
Now, let’s take another look at that example with more than one day’s worth of pivot point data.
Multiple Days of Pivot Points
As you can see in the chart, there are a number of resistance levels near our closing price on the day. Like any other indicator, there is no guarantee the price will stop on a dime and retreat.
The point of highlighting these additional resistance levels is to show you that you should be aware of the key levels in the market at play.
You will need to look at the level 2 or time and sales to see which level you need to focus on. This is the real challenge. If you immediately sell you might possibly forego big profits.
As an option, you could sell out at the next resistance level up. You might be leaving money on the table, but there is a greater risk of being greedy and looking for too much in the trade.
Placing Stops
Trading with pivot points allows you the ability to place clear stops on your chart. What you do not want to do is simply place your stops in line with the next level up or down.
You have to take more care when identifying your stop placement.
Remember, you are not the only one that is able to see pivot point levels.
Anyone with a charting application can know the R1, R2 and R3 levels.
So, how do you still protect your trade but without risking too much?
Beyond Key Psychological Price Levels
For starters, you could place your stop just beyond the levels. In other words, you will want to hide the stop behind logical price levels.
For example, if you have an S1 level at $19.65, then you will want to place your stop at $19.44. Why at this level? 50 cents is a big mental price level for stocks under $20 bucks.
Therefore, you will likely have a large number of stops right at the level. Therefore, if you place your stop slightly beyond this point, you might avoid being stopped out of the trade as a shake out.
Volume at Price
Another method is to look at the amount of volume at each price level. If you are long and are eyeing an S1 level to stop the selling pressure, you can also see how much volume has been traded at a certain price level.
The idea is to then place your stop slightly below or above these levels. Let’s look at a chart to illustrate this point.
Volume at Price – Pivot Points
In the above example, notice how the volume at the support level was light. This shows you that there was not a lot of selling pressure at this point and a rebound was likely to occur at this level.
Next, notice how the price barely breached the S3 level and then reversed higher. For this type of setup, you want to see the price hold support and then set your target at a resistance level that has accompanying volume.
After BLFS bounced, it ran up to the R1 resistance before consolidating which coincidentally had a decent amount of volume at the $19.15 price level.
If you were long, a stop directly below the S3 level would have kept you in the trade.
How to Practice with Pivot Points
Hopefully you now have an intimate knowledge about Pivot Points: their formulas, strategies, and usefulness for day traders.
As with any trading strategy, it takes time and practice to really gain the upper hand on the market. For this reason, there is no better way to practice Pivot Points than in a simulator.
We suggest trying at least a 20-trade sample of this strategy and analyzing those trades before putting real money to work.
Traders have two main options for their accounts: margin vs. cash. When deciding to choose a margin account vs. cash account, there are many factors to consider. In this TradingSim article, I’ll explain the difference between a margin vs. cash account. I’ll also write about how experienced day traders or people who are new to investing can choose the best account for them to have the best trading strategy.
What is a margin account?
If an investor is investing on their own, they may have limited funds. If they need more money, they can deposit cash and a brokerage firm can loan them money, too. That’s leveraged investing for traders. In a margin account, day traders can borrow money to fund their accounts. It’s similar to using credit cards to make purchases when a card company extends credit to a customer.
“Using margin to buy stocks is similar to using a mortgage to buy a house. In both instances, investors borrow money to purchase more equity in stocks or real estate,” said Hashemian.
What do brokers like Robinhood charge to trade on margin?
When traders are trading on margin, they’re charged interest on a margin interest loan. In the popular Robinhood app, users are required to have $2,000 in their accounts before they can trade on margin.
In Robinhood’s $5 monthly fee, the first $1,000 of margin is included. If traders borrow more than $1,000, they pay 5% interest on the leveraged investing. For example, if a trader uses $3,000 of margin, they’re charged a daily interest rate of 5% divided by 360 for each day of the trading year.
In that case, $1,000 is deducted from the $3,000. The remaining $2,000 has interest added on to that amount. Then, it’s $2,000 x 5%/360= $0.28 daily interest. While Robinhood charges 5% interest, each brokerage firm has its own interest and may be significantly higher. Investors should check margin interest rates with their firms.
What are the rules for a margin account?
Before an investors trades on margin, there are some rules a trader must follow. When an investor trades on margin, the Financial Industry Regulatory Authority(FINRA) that regulates trade has requirements. FINRA mandates that a trader must have either $2,000 in their account or 100% of the stock purchase prices.
Once a trader has $2,000 in their account, they can trade 50% of the securities they’re going to purchase. For example, if a trader has $2,000 in a margin account, they can buy $4,000 worth of stocks on margin.
Apple stock can be bought with margin account vs. cash account
After a trader buys an asset on margin, they have to maintain a certain balance in their accounts. A trader has to outright own 25% of assets in their accounts.
A brokerage firm may also ask for a trader’s net worth and income. In addition, a firm may conduct a credit check before an investor can trade on margin.
What are the advantages of a margin account?
If traders need to trade on margin, there are some benefits. There is a potential to profit from trades. For example, a person buys shares of Apple stock for $100,000 with a mix of $50,000 cash and $50,000 margin. If you sell the stock for $125,000, the trader has a $25,000 profit.
If a trader borrows on margin, they can have a brokerage firm give them extra leverage to make larger trades.
“One of the things I love about Robinhood is it’s … drawn millions of new people into the market. If we want people to become more savvy about personal finance and investing — and I think we generally say that we do — then I think they need to have the experience of being an investor. I don’t think those are things that you can necessarily learn just in a textbook,” wrote Kaissar.
“We believe that broader participation in the markets is more democratic and can bring opportunities to many. Those who dismiss retail investors as ‘gamblers’ or ‘gamers’ perpetuate the myth that investing is only for the wealthy and highly educated,” said the Robinhood spokesperson.
Some financial advisors say margin wins in margin vs. cash accounts
“We generally encourage [margin accounts] with our clients even if we don’t plan to do leveraged investing with them. Sometimes a client needs money in a hurry, and instead of having to sell securities and wait two days, you can take the money out immediately and sell the securities the next day or the next week. You don’t have to wait as long to get the cash out,” said Davis.
“If you really want to buy an investment and you don’t have the cash instantly available, it’s a quick way to make sure that you have it,” added Davis.
In addition to that benefit, buying stocks on margin can give investors more time to repay the loans. A brokerage firm gives a trader extra time to repay a margin loan. An investor can repay a loan whenever they can as long as they maintain a margin account balance.
Trading on margin better for experienced traders
For some experienced traders, trading on margin can be effective. Tom Watts is the chairman of Watts Capital Partners. He advises that traders use margin if they’re experienced traders and have extra money. The margin can be used for those traders as an emergency fund for transactions.
“For most of our clients, we like to have a margin account even if they never buy stocks on margin because they can transfer money faster,” said Watts.
“With a margin account, they don’t have to wait: They can access cash instantly,” added Watts.
Watts also recommends margin trading if you have time to actively trade and stop losses to limit trading mistakes.
“If you’re in front of your terminal every day, you have strict loss limits and you have a trader mentality, margin investing can be a great thing in up markets. But investors should only do it when the market is going to keep going up and have very strict loss limits,” said Watts.
Buying stocks on margin can postpone capital gains taxes
Nate Wenner is a certified financial planner with Wipfli Financial Advisors. He notes that margin loans let investors postpone paying capital gains taxes. If investors need to make a large purchase, selling investments would lead to capital gains taxes. When traders buy stocks on margin, they can postpone capital gains taxes.
“By taking a margin loan, [you] don’t have any transactions and there’s no tax recognized. In most cases, our clients don’t keep this margin loan for months and years on end…They try to pay it back when they have the cash flow, maybe from a bonus at work,” said Wenner.
In addition to that tax advantage, the interest on a margin loan may be tax-deductible under certain circumstances.
Forex trading on margin is most common
While margin can used for regular stock trades, forex (foreign exchange) margin is the most generous.
‘Generally, forex rules allow for the most leverage, followed by futures, then equities. Depending on the product, forex and futures leverage can be at 20:1 or even 50:1 compared to equities’ overnight margin of 4:1,” said Klink.
“Geopolitical tensions, economic news, central bank policy decisions … a multitude of things move the forex market every day, and so there are several different reasons to consider using margin in forex trading,” said Hickerson.
“Currency prices change every day, meaning margin requirements for forex positions may also change every day. It’s important to understand that if the base currency is anything other than the U.S. dollar, the margin requirement is going to fluctuate on a real-time basis as the price of the base currency changes relative to the U.S. dollar,” added Henderson.
What are the disadvantages of a margin account?
While there are advantages to having a margin account, there are drawbacks as well. Scott Bishop is a certified financial planner with STA Wealth Management. He advises against traders, especially new investors, from buying stocks on margin because investors may be too emotional and trade too quickly.
“Should the average investor buy stock on margin?” asked Bishop. “No, because the average investor buys on greed and sells on fear,” said Bishop.
Timothy Hooker is a co-founder and accredited investment fiduciary at Dynamic Wealth Solutions. He commented that experienced traders can trade on margin with minimal risk. However, too much leveraged investing can be dangerous.
“If you’re an experienced trader and know what you’re doing, there’s nothing wrong with using margin. But if you’re really trying to take your account to the moon and back, then that’s where you can blow up your account and really derail your financial plan,” said Hooker.
John Person is the founder of Persons Planet, a trading education and advisory service company. He advises investors not to borrow more than 25% from their accounts to buy stocks on margin.
“A small amount of your portfolio can be used to extract cash for small loans. Borrowing more than 25% of your total portfolio is ludicrous because the market can go down,” said Person.
High interest rates can cause problems for margin accounts
“Interest rates on margin loans quite consistently seem to be 3% or 4% higher than what you would get for a home equity line or some other reasonable type of debt,” said Cody.
“Anything you buy can go down in value, so when you buy investments on margin, you’re exposed to more risks because you have liability in terms of the cash you’re borrowing. You have to make sure your investments don’t lose so much value that you lose more than what you owe,” said Davis.
What do financial experts say about trading on margin?
“Take an investment that offers an expected return of 15 percent, but with actual results that might range between 15 percent and 30 percent,” said Sury. “Even if the cost of borrowing is low, say 4 percent, the transaction is very risky.
“On the other hand, if a collection of diversified investments can offer a 10 percent rate of return with a narrower range of 9 percent to 11 percent, then the risk of the transaction has been dramatically reduced,” added Sury.
“When leverage works, it magnifies your gains … but leverage is addictive. Once having profited from its wonders, very few people retreat to more conservative practices,” said Bufffett.
Financial expert Lyn Alden also said that traders should be experts in the industry they’re investing in before they trade on margin.
If you understand your industry and you’re trading something of value, you should be able to use debt to trade more,” said Alden.
“These types of ‘good debt’ give far lower interest rates for people with good credit than the typical margin rates offered by brokers,” added Alden.
Tesla margin requirements impact investors
As Tesla raised its margin requirement from 55 to 79%, there have been consequences for investors. Tesla’s margin requirement is the amount of cash a trader has in their account instead of credit.
“A lot of people that got this message yesterday had to sell shares. Multiple people I talked to overnight were forced to liquidate Tesla shares. Multiple people. And these are people who were positive, up on Tesla, and they had to sell by the close yesterday,” said Raznick.
“This is happening because large institutions are buying shares of Tesla, and brokerage firms want to free up shares to sell these large institutions,” added Raznick.
Raznick said that traders are selling Tesla stock because of their margin.
“There are people selling this stock right now not because they want to, not because they have bad fundamentals; they are being forced to. Including myself and including some others, we are forced to sell stock because of the margin we have on it, and I do believe that represents a potential long-term trading opportunity,” said Raznick.
Investors shouldn’t buy too many stocks on margin, experts warn
‘I would only recommend using a margin account for the purpose of having additional flexibility on when you can withdraw cash. But I wouldn’t recommend having a margin account to invest as part of their strategic plan unless they’re working with a sophisticated financial advisor or are a sophisticated investor themselves,” said Davis.
Ali Hashemian says that investors can buy more stocks on margin in a bear market. However, he warns that traders not to buy too many shares on margin when the stock market is down.
“An investor might want to use margin to purchase more shares in a down market. The problem is that nobody can predict the bottom,” said Hashemian.
“This should be done when the expected return of the investment being made is greater than the cost of leverage. And when the risk profile of the investment and the client’s overall portfolio is commensurate with his or her risk tolerance,” said Remy.
Financial advisers advise traders to borrow on margin carefully
Many young investors are flocking to trading on margin. Chris Larkin is managing director of trading and investment product at E-Trade Financial.
When it comes to Millennials and Gen Z investors, time is on their side, but that doesn’t mean they can be complacent or act emotionally,” said Larkin.
“Access to the market has never been easier, so investors just embarking on trading should walk before they run. A thoughtful and disciplined approach is key—do your research, set up watch lists, and align your trading strategy with your goals and risk tolerance,” added Larkin.
Borrowing on margin can also create problems, like being on margin call.
What happens when an account is on margin call?
When an account is on margin call, a trader is in trouble. If a trader hasn’t maintained a minimum balance of 25% outright owned assets in their account, they’re put on margin call.
Margin call is when maintenance margin falls below a certain limit
Nate Wenner is a certified financial planner. He notes the danger of trading on margin if investors can’t maintain their margin account balances.
“This makes it a dangerous game to play,” said Wenner.
For example, a trader wants to invest $150,000 in a stock whose shares are $100. A trader invests $25,000 and borrows the rest on margin. A brokerage firm can then institute a 30% margin maintenance on their accounts.
If shares fall to $70, a trader’s margin can fall down to $87,000. That amount may be above the margin maintenance threshold. However, if the stock keeps falling and the margin maintenance account drops to below the 30% threshold, the trader is placed on margin call.
Will margin accounts be in more danger after the quarantine?
‘In the coming weeks, I expect that we will see a significant increase in complaints related to suitability, specifically use of margin in retail accounts. I expect many will have been unsuitable and will require investigations by regulators,” said Gerrold.
“Processes, procedures, and staff must be in place so that investors can reach their financial professional to ask questions, raise concerns, and discuss investment options. We’ve heard–and these have been very public–about trading delays and crashes of electronic systems at some of the largest broker-dealers in the last couple weeks,” said Gerrold.
What should investors do when they’re on margin call?
If an investor is on margin call, then an investor has to take action. A trader has to have deposit funds to meet the margin minimum, usually within three business days. If a trader doesn’t have the funds right away, they may have to sell stocks in order to meet the margin minimum. Firms may also totally liquidate a trader’s account if they can’t pay off their margin call.
If a trader can’t pay the margin call, a brokerage firm may have to report your debt to a credit agency. A trader’s credit could be negatively impacted for a long time.
How can an investor avoid margin call?
There are ways for investors to avoid margin call. If an investor is able, they should have an emergency fund on hand in case there is a margin call. A trader should also be knowledgable about the margin requirements before buying stocks on margin. In addition to those measures, traders can use stop-loss measures to prevent themselves from plunging into debt. With stop-loss measures, traders can limit their margin losses.
As TradingSim’s own Al Hill told Mint, traders shouldn’t use all of their margin when buying individual stocks. Only a small percentage is best fro each individual trade, especially for beginning investors.
“Only use 10 percent of your margin. For example, if you have $100k cash, which would afford you $400k in margin, only use $40k on any one position”, said Hill.
“I’ve been through the ringer in terms of all manner of investment and gambling. To be honest, I regret that I’m doing this now. I won’t tell you how much I’ve lost but it’s in the thousands,” said Ahmed.
If traders want to trade on margin, they have to exercise a lot of caution and be prepared for losses.
How can investors trade with a cash account?
If trading on margin is too risky, investors can trade using cash accounts. In cash accounts, investors can simply buy stocks with their available cash. For instance, if a trader has $1,000 in an account, they can only buy $1,000 worth of stocks.
What is the difference between a margin account vs. cash account?
While a trader can trade right away by borrowing on margin, having a cash account requires an investor to have more patience.
“In a cash account, if you buy and you sell, you have to wait for that sale to settle before you can use the funds again. Some clients may find it worthwhile to use a margin account every now and then to be able to buy what they want to buy, when they want to buy it, and borrow with margin for a short period of time,” said Herman.
What are the benefits of using cash accounts?
In contrast to margin trading, cash accounts are a one-time investment. Patrick Lach is a certified financial planner and assistant professor of finance at Indiana University. He noted that investing on margin requires extra cash to maintain an account. On the other hand, cash accounts don’t have that requirement.
“This is a major risk of margin investing. It may require the investor to come up with additional cash to maintain the position. This is not an issue with cash accounts—they only require a one-time, up-front investment of cash,” said Lach.
He also noted that when there is a margin call, investments have to be sold and lose value quickly. However, Lach noted that with a cash account, investors have time to recover from their losses with cash accounts.
“With a cash account, the investor has the luxury of waiting for a stock to recover in price before selling at a loss,” said Lach.
What are the disadvantages of a cash account?
While there are advantages to having a margin account, there are drawbacks as well. If a trader wants to trade in a hurry, they’re unable to with a cash account. Cash must settle before a trade officially takes place.
For instance, if a trader uses $500 in their account to make a trade on Monday, they can’t make a trade with that same $500 until Thursday at the earliest. That delay is called a settlement and is part of the transfer of assets to a buyer’s account and cash to a seller’s account.
Another problem with cash accounts is having good faith violations. A good faith violation is when investors make trades before cash has settled. If traders make these violations three or four times, they can put into a 90-day trading restriction.
Facebook stock a popular stock to trade in margin vs. cash account
“If you call us after you do something, it’s harder for us to assist you, so calling us and asking what will happen in a situation is sometimes better. That way we can walk you through all of your choices at that point,” said Merritt.
What other violations can jeopardize a cash account?
In addition to good faith violations, free riding violations can hinder a cash account. Freeriding occurs when a trader tries to buy or sell a stock without depositing enough funds before settlement. One way to have a free riding violation is to use the same capital on the same day on two separate trades. A trader can buy a security and sells it before settling the first purchase.
For example, a trader has 500 shares of Ford (NYSE:F) with shares at $20 on Thursday. A trader needs $10,000 to settle the transaction. On Friday, Ford’s stock rises to $25. As a result, the trader earns $25,000. However, if a trader didn’t settle the original trade without the new sale’s profits. If an investor can’t settle the first trade, then the trader is freeriding.
If a trader is freeriding, a brokerage firm can freeze a trader’s account for 90 days. In the middle of the freeze, a trader can use a cash account to make trades. However, a trader has to settle all purchases on the trade date.
How to cash in a margin account
In a margin vs. cash account, cashing in a margin account takes certain steps. A trader can close their account and completely cash out their margin accounts. First, an investor has to sell their investments. Then, a trader has to make sure their margin loan balance is at zero. Then, an investor has to close the officially close the account through a broker.
If an investor wants to cash out their margin loan balance, there are steps that traders can take. They can request a cash withdrawal with available funds minus the margin loan amount. Once the cash is withdrawn, a trader can make sure the money is transferred to another account. Then, an investor’s brokerage margin account shows the next margin loan balance.
Which account wins in margin vs. cash account?
When choosing between a margin vs. cash account, a trader has to make many considerations. If a trader wants to day trade often without fear of pattern day trader status, a cash account may be best. A cash account may also be best for traders who have the patience to wait until their settlement period of two or three days.
If a trader wants to trade right away but has limited funds, margin trading may be best for them. Also, if a trader wants to trade volatile and high-risk assets like forex, margin trading may be their best option.
Ultimately, a trader has to make the best decision for them about deciding between a margin vs. cash account.
Regardless of which account a trader uses, TradingSim can help traders whether they choose a margin vs. cash account. With TradingSim’s blogs and charts, traders can find the best accounts for them to potentially increase their profits.
Working from home during the COVID-19 pandemic
Day trading stocks can be a successful way to create income- but it’s not easy. Many people want to make a profit in this bear market, but there are many challenges that day traders face in the COVID-19 era. This TradingSim article will explore how the real benefits and costs of being a day trader. The article will also teach day traders how to trade stocks from home and help them find the best strategies and stock picks to become a successful trader.
How do you get started day trading part-time?
Day trading involves quickly trading securities several times a day. Traders buy and sell stocks often throughout a trading day to make a quick profit. Volatility in the stock market helps day traders make a larger profit. However, stock fluctuations can backfire if a trader trades too hastily or makes a bad trade.
When is the best time to trade?
The best time to day trading is at the start of the day at 9:30 AM EST. The first hour of the trading day can be the most pivotal because there is more liquidity, when there is a higher volume of trading in the first trading hour. and there is the most volatility at the start of the trading day.
The other ideal time to day trade stocks is at the end of the trading day from 3 PM-4PM EST. Just as at the beginning of the trading day, high volatility at the end of the day can help day traders maximize profits.
What is a good day trading strategy?
Before traders get serious about day trading, they have to make some important decisions. Here are some things to consider before they start day trading stock strategy.
Determine whether you have the time and patience to day trade. Day trading is not a hobby. It’s a time-consuming job that takes up hours of a trader’s day. Even though day trading moves fast, a lot of methodical thinking is required to day trade stocks. Day traders also need excellent math skills, risk-taking abilities, and discipline to study the changes in the stock market.
Study the stock market. Day traders need to diligently study the stock market to be a successful trader. Traders have to possess a wide range of financial knowledge to withstand the ups and downs of the Dow Jones and NASDAQ. It can take years to master the stock market, so studying the nuances of the market is essential.
Study the different securities to trade. Day traders not only trade stocks. Traders have to research ETFs, foreign currency, or other assets to trade if they want to branch out beyond stocks. Novice traders may not realize that there are different rules and strategies for various assets.
Practice trading with simulated trading. Before traders risk their own capital, they should test their trading strategies. TradingSim would be a perfect outlet for traders to try out simulated trades before they decide to risk real money in the markets.
Start small, then expand. Once a trader has the capital, they should still slowly delve into trading stocks. Day traders should start small to minimize risk. If a day trader suffers losses, it won’t be as devastating if there is less money on the line. When a trader experiences success after three months, they can incrementally put more money into the markets. If they are still struggling after 90 days, they should maintain or even decrease the amount they have invested.
How much money do day traders need to start?
While there is no set amount to start day trading stocks, there is an amount that should be sufficient to weather the unpredictability of the stock market. When a day trader is ready to invest, they must have a lot of money saved to quickly buy and sell shares.
A trader should have at least $10,000 in disposable income ready to invest in the stock market. The Securities Exchange Commission notes that ideally, a day trader should have at least $25,000 in their day trading accounts. If a potential trader can’t afford to risk that much capital to withstand market volatility, they aren’t ready to day trade stocks.
A beginning day trader’s account also depends on what asset is being sold. To buy stocks, a trader needs at least $25,000. However, for day trading futures, $10,000 is recommended. For trading forex, $100 is likely the lowest amount needed. No matter what asset day traders buy and sell, all traders shouldn’t risk more than 1% of their trading income on one trade. For instance, if a day trader has $25,000 in their account, they should risk more than $2,500 on a single trade.
What equipment does a day trader need to work from home?
In order to treat day trading stocks like a work-from-home business, a day trader needs the right equipment. Traders should invest in a trading machine and trading software. Day traders should also have two monitors to watch charts and data.
Trading Monitors
The most important day trading equipment may be a steady internet connection. With a reliable wi-fi connection, traders have less risk of missing important trades if there’s an internet crash. A backup internet connection is also recommended for traders who are day trading at home.
Why is there a resurgence in day trading stocks?
Once investors start day trading stocks, they can join a plethora of new investors. There has been a recent revival in day trading for two key reasons. The recent volatility in the stock market has led many people to try to make money by day trading stocks.
“Investors are increasingly asking us about the participation of individual investors in the shares and options market. Our data suggests that individual investors are indeed a significant proportion of daily volume, ” noted Goldman Sachs analysts.
Sports betting drought leads to day trading increase
Sports Betting
Another reason for the resurgence in day trading stocks is strangely enough because of sports. COVID-19 shut down sports events, so there were fans missing games to watch- and bet on as well. Instead of betting on the performance of LeBron James, gamblers are now betting on the performance of Tesla (NASDAQ:TSLA) stock.
In addition to trading on their own, sports gamblers are also following the stock picks from the head of a sports website. Barstool Sports’ Dave Portnoy has picked winning stocks during this bear market. He compares day trading in the current market to the unpredictability of a sports event.
“With the volatility, it is kind of like watching a sports game,” said Portnoy.
Jim Bianco is president and macro strategist at Bianco Research and monitors day trading trends. He noted that young gamblers are moving to day trading with the latest sports hiatus.
“Sports gambling is a huge business in this country and a lot of sports gamblers and a lot of these millennial gamers are now playing the stock market, day trading,” said Bianco.
“I’m a little surprised that it’s become pretty well known within the financial community. That’s kind of our target audience regardless of what we’re covering and I think Barstool was popular in those circles to begin with,” said Portnoy.
Portnoy’s contrarian investing is a day trading strategy that can work if a day trader is diligent and studies the markets well. If a day trader is savvy with their trades, they may profit from going against the popular opinion of Wall Street experts.
Zero-commission apps lead to more day trading
Zero Commission
The rise of Robinhood and other zero-commission trading apps are helping drive the rise of day trading. Andrew Laphorne is a stock analyst at Societe Generale. He said that new day traders bought cheap stocks as the economy cratered and profited as the market is slowly rebounding now.
“For all the mocking of Robinhood investors, their timing back into the market looks impeccable, with a significant pick-up in holdings as equity markets bottomed in mid-March,” noted Laphorne.
Airlines rebound with new day traders
Despite Warren Buffett selling airline stocks, young day traders are lifting the industry back up. An airline ETF, JETS, saw its value rise a whopping 2,000%. Millennial day traders purchasing the ETF led to its rebound.
Frank Holmes, chief executive officer of JETS issuer U.S. Global Investors, loves the recovery. He believes that young day traders buying the dip helped JETS’ value grow to $1 billion.
“All these millennials, being stuck at home with no bars to go to and no beaches to travel to, took their money and became day traders. They’re bored, they want to make money,” said Holmes.
Financial advisors cheer new growth in day trading stocks
Many financial advisors welcome the new breed of day traders. Nate Geraci is president of the investment advisory firm, the ETF Store. He sees Portnoy as a social media savvy version of investing giant Warren Buffett. Geraci also credits Portnoy for making day trading entertaining to his millennial followers.
“It’s really been a perfect storm. Investors are seeing firsthand the thrill of victory, the agony of defeat, and he’s doing it with large sums of money, so I think for younger investors, that’s really enticing,” said Geraci.
Day trading may be best for people who want to make quick profits from short sales. For short-term investors, day trading can be a quick way to earn money. Josh Brown is the chief executive of Ritholz Wealth Management and says day traders are just having fun day trading stocks.
“They’re not expecting to retire off of trading stocks. They’re having fun and they’re learning the market, and I think it’s great,” said Brown.
Day trading can also best for self-starters who want to work independently. Day trading stocks may be best for traders who learn best by learning on their own.
What are the risks of day trading?
While there are some benefits to day trading stocks, there are many risks associated with day trading.
“I’m not a financial advisor. Don’t trust anything I say about stocks,” said Portnoy.
Elliott Wave Day Trading Example
While Portnoy’s day trading venture is currently paying off, it’s risky to follow advice from people who aren’t financial experts. In addition to not listening to experts, day traders shouldn’t just follow their emotions. Making rash trades based on emotion leads to more losses. Traders who buy and sell stocks without stop-loss limits can risk losing more capital than they can afford.
Day traders can lose a lot of money if they don’t limit their number of trades. Trading too much can lead to a lot of fees for traders. Setting stop-loss orders can help minimize risk. Many traders also buy stocks on margin and borrow too much money to trade stocks. Day traders should stick to a set limit on how much to trade and not depend too much on margin and leverage.
Financial experts warn about day trading inexperience
Day trading novices may feel a rush from their new venture, but there are risks. Caleb Silver, Investopedia’s editor-in-chief, believes that day trading beginners should be cautious with the large volatility in the stock market.
“People are new to trading and new to investing and want to take advantage of these wild swings,” said Silver.
“These are the most dangerous times to start day trading … This is when people really get hurt,” added Silver.
“This is a super volatile time. You could lose your shirt in a day. You could gain two shirts back the next day, but you have to know what your limits are,” said Silver.
“We have day traders who are able to go into margin with next to 0% interest. They’ve got nothing else to do. Their transaction costs are zero,” said Cuban.
Cuban also believes that once the economy slows again, there will be huge sell-off among day traders.
“You can also make the argument that this whole run-up is just buying the rumor. Once we start to really have definitive data on the other side, people are going to sell on the news, and if I had to make a bet, that’s it,” said Cuban.
Cuban also noted that the resurgence in the stock market will depend on how many workers are rehired.
“A key question is how many workers will be rehired and how consumer spending will fare once enhanced unemployment benefits end on July 31,” noted Cuban.
Cuban doesn’t think that day traders are fully prepared for another economic slowdown.
“We don’t know if all the jobs are going to be there, and we don’t know what happens with demand. I don’t think the market is truly understanding the challenges that we may be facing,” added Cuban.
Day trading rarely leads to profits
In addition to the risk of losing money, there is the risk of not earning much money at all. While many day traders tout the quick money that can be made, those profits rarely come through. A Brazilian study found that only 0.1% of day traders earned more than the nation’s minimum wage after almost a year of day trading stocks. The study noted the poor success rate of independent day traders.
“97% of them lost money, only 0.4% earned more than a bank teller (US$54 per day), and the top individual earned only US$310 per day with great risk (a standard deviation of US$2,560). Additionally, we find no evidence of learning by day trading,” noted the study.
Day traders should expect to lose a lot of money before they see any profits. Even if traders earn any income, they can lose portions of their wins through high taxes. Short-term gains are taxed at a higher rate than long-term capital gains.
What advice do day traders give?
Day traders can get advice from more experienced traders. Jason Bond is an experienced trader that touts his experience as a trader.
“Having trained multiple clients who’ve gone from cubicles with small trading accounts between $10,000 to $37,000 to successful, full-time day traders, making millions in just a few years, I have verified proof people can make the leap from their career to trading full time,” said Bond.
“The best way to become a day trader is to learn from existing profitable day traders. There’s an overwhelming amount of theoretical material on the internet about how to day trade, but nothing beats learning from someone who is currently successful at it,” said Bond.
“One of the best ways to control risk is limiting the length of the trade. The longer you are in a position, the greater the likelihood is that price could move against you. By day trading, you eliminate overnight and weekend risk, especially when you trade markets that close, like stocks,” said Wendell.
Discipline is key to day trading stocks
Discipline
While Bond had success as a trader, many other day traders note that success doesn’t come easily. Deeyana Angelo is a managing director of Market Stalkers. She stresses that being a day trader requires a lot of training and discipline.
“Becoming a day trader is something that a lot of people see as an easy way to make money where you don’t need much experience – just click a few buttons and hey presto, you’re rich! But nothing is further from the truth,” said Angelo.
Brandon Wendell, an investment expert, noted that limiting risk and not holding stocks for too long is key to success as a day trader.
“Day trading is a very difficult performance discipline, much like becoming a professional football player or playing a musical instrument to a virtuoso level. You first need to have a natural talent, followed by years of practice,” added Angelo.
Merlin Rothfeld is an investment strategist that studies day trading. Rothfeld advises investors who are day trading stocks to be patient because they will monitoring screens all day. Rothfeld also doesn’t want traders to stray from a well-thought-out trading strategy out of fear or haste.
MIdday Trading
“Quite often, day traders will take trades because they are just sitting in front of their screen all day. A forced trade is generally going to be a losing trade. Always follow your rules,” said Rothfeld.
How much do day traders make?
A day trader’s salary can vary greatly. If a trader is working independently, they face an uphill climb to a steady salary. Freelance day trading is similar to a sales position. There are times when income is high, especially if trades are executed well. A day trader may also make very little money if the stock market tumbles or a trading strategy backfires.
An independent day trader’s salary will also depend on how much capital they have invested in the stock market. As noted in a previous TradingSim article about a day trader’s salary, an average day trader’s salary has a 20% annual return. If a trader has $100,000 in an account, they may have profits of $20,000 in the best-case scenario.
Day trading for a firm has a more stable salary. According to ZipRecruiter, the average salary of a day trader is $80,000. However, that depends on experience and the city a trader is located in as well.
If a day trader has years of experience and lives in a small town, that’s a substantial amount of money. However, if a day trader has substantial debt from buying stocks on margin, lives in a major city, and has other major expenses, that amount may not go as far as originally thought.
How does day trading at home compare to working from a firm?
There are many differences between day trading stocks at home and at a proprietary trading firm. When a day trader is working from home, they have more flexibility. Day trading stocks requires a lot of studying and commitment. Traders can focus on the stock market in their home offices and their trades without distractions in a noisy firm. Day traders can also keep more of their profits than a trader in a firm.
However, there are downsides as well. Many distractions from friends, family, and IT emergencies can derail a trading day. Day trading at home means that they have to shoulder economic burdens on their own.
For day traders in private trading firms, there are some advantages. Day traders in an office can have more help on a trading floor from more experienced traders. Day trading with a firm’s funds lessens a financial burden of day traders.
There disadvantages of being a day trader in a proprietary firm as well. Day traders in proprietary firms are just paid as contractors and not salaried employees. They also keep less of their profits than an independent trader. Day traders in firms often have to pay for training fees or give their employers a cut of their profits.
How does day trading at home compare to other work-from-home jobs?
Day trading can be much more challenging than other work-from-home jobs. There is a range of jobs that pay less and some that pay more than day trading at home.
Working from home is a growing option. A study from Upwork and the Freelancers Union found that over 50% of workers were working from home just three years ago. After the COVID-19 pandemic, that number is sure to increase.
If a trader from home can make $40,000 a year on average, there are jobs that pay less. Virtual assistants that perform administrative duties can make on average $26,000 a year. Freelance writers can earn a range from $10,000 to $30,000 a year.
Those careers pay less than an average day trader’s salary. There are some work-from-home jobs that pay more like in the customer service industry.
Brie Reynolds is a career development expert at work-from job site FlexJobs. She notes that customer service is an in-demand job that can pay more steadily than day trading stocks at home.
“Customer Service is the No. 1 field for remote jobs right now. This is a field without a lot of barriers to entry in terms of experience or education levels. Unemployed retail workers who enjoy helping people may be able to use their skills in communication, problem- solving and sales to transition to a remote customer service job,” said Reynolds.
Customer service jobs may pay as much as $60,000 a year. Data and IT work-from home jobs are the most lucrative. Data analysts can make $50,000 a year. A website support specialist can earn $100,000 a year.
Some jobs pay less and some are more lucrative than day trading from home. Day trading is on average at the low end of the spectrum with earnings of $20,000-$30,000 a year
How do day traders find the best stocks?
As noted in a previous TradingSim article about finding the best stocks to day trade, there are methods to pick top stocks. Day traders should look for stocks that have high volume to move quickly in and out of their positions. They can monitor them on financial websites like Yahoo Finance. TradingSim charts enable day traders to simulate trading and test out their strategies before investing in stocks.
Below are five stocks that would be best for day traders that are day trading at home.
1. Apple
As a TradingSim article noted, Apple(NASDAQ:AAPL) is a perfect stock for day traders. Apple is moving 22 million shares are bought and sold daily. The tech giant’s high volume makes the stock attractive to day traders.
Financial experts rate Apple as a buy
Many financial experts think that Apple is a buy in this bull market. Todd Gordon is managing director at Ascent Wealth Partners and monitors Apple stock. He believes that Apple stock can rise 40% over the next few weeks.
“If you look at the three advances since 2013, each has been at least 130% followed by a one-third giveback. The current advance is only 66%, so we can easily — if history is to repeat — see another 70% in years to come, putting us at $490 potentially,” said Gordon.
Apple stock
Steve Chiavarone, portfolio manager at Federated Hermes, also believes that a strong balance sheet and consumer demand will drive high volumes of Apple stock.
“Growth has been the new defensive. Strong cash flows have met strong balance sheets which means you haven’t been under pressure because you needed external financing, and your return on capital is safe,” said Chiavarone.
He also believes Apple “consumers have pent-up demand. They have stockpiled savings, and we expect the consumer to have a good second half.”
Charts show Apple stock a top pick for day traders
Blue Line Capital President Bill Baruch noted that charts show that Apple avoided a death cross. A death cross is when the 50-day moving average moves below the 200-day moving average. Apple has avoided that drop, which makes it a top pick for day trading, according to Baruch.
“It broke out above last year’s high, a big resistance level at $327. Now, that is support, and overall you also have a rising trend line from the lows in March, and for me $327 to $330 is going to be a huge support level,” said Baruch.
“I also want to point out that it did not get the death cross, and the fact that the 50-day moving average rejected crossing below the 200-day moving average in May — it fueled the upside as it has done in many of the tech stocks,” added Baruch.
Apple’s high volume of stock movement and bullish analysis from financial experts make the stock a top pick for day traders.
2. Facebook
Facebook
As noted in a TradingSim e-book, Facebook(NASDAQ:FB) is a favorite stock for day traders. Facebook has 25 million shares moving daily. The liquidity makes Facebook an ideal stock for day traders to quickly exit positions. Facebook CEO Mark Zuckerberg noted that the company’s success depends on its Marketplace division and dependence on small businesses.
“Overall, though, our business depends on the success of small businesses. So, this is a moment where we feel that we’re well-positioned to be champions for small businesses interests and supporters of important infrastructure that they’re going to need in order to move online,” said Zuckerberg.
“The firm should benefit from: a) the continued growth in e-commerce and b) the growing propensity of consumers to shop within social media apps,” said Bezinet.
3. Tesla
Electric Car
Tesla(NASDAQ:TSLA) would be a great stock for day traders that want a stock with high volume and volatility. The corporation’s stock is trading at 16 million shares a day. The electric car company’s stock soared to $1,000 a share after a better-than-average rate of car deliveries.
Jefferies upgraded its price target of Tesla up to $1,200 after Tesla’s stock climbed. Analyst Phillipe Houchois wrote in a note to clients that coronavirus will drive consumers to want more electric automobiles like Tesla.
“We see COVID-19 as an accelerator of the transition to EVs and renewables, from consumers and public policy,” said Houchois.
“Tesla remains significantly ahead of peers in product range, capacity and technology. Near term, EV-friendly incentives in the European Union and lower-priced Model 3 support second-half volume, making Tesla more resilient than peers,” wrote Horchois.
“Against expectations even a few months back, the gap with peers is widening, from product to battery tech/capacity,” added Horchois.
“We’d look to become more positive on Tesla stock again if we had more confidence in the near to intermediate-term trajectory of fundamentals, or if valuation became more attractive. We maintain our view that the electric vehicle market offers attractive long-term growth, and we think Tesla will be able to sustain a leading position in EVs[electric vehicles] (and with solid margins),” noted Goldman Sachs.
Morgan Stanley also downgraded its rating because of something that may be a benefit to day traders- Tesla’s high volatility.
“While Tesla has long been an expensive stock, and we recognize that valuation has expanded for the entire market, we believe that there is a higher bar for Tesla’s fundamentals than other stocks that may have challenging near-term results given Tesla’s premium absolute multiple along with the historical volatility of Tesla shares,” said Morgan Stanley.
While establishment banks may disapprove of Tesla’s volatility, the high volatility and volume make the stock a good choice for day traders.
4. Microsoft
Microsoft (NASDAQ:MSFT) is another large-cap, high-volume stock that may be good for day traders. The corporation’s stock rose after a positive Q1 2020 earnings report. Jefferies analyst Brent Thill rated Microsoft stock a solid buy. The work-from-home boom during the recent quarantine boosted its Microsoft Teams service.
Microsoft stock
“The biggest beneficiary of the new work from home environment is in the productivity suite and especially Microsoft Teams, which has seen a large spike in demand,” wrote Thill in a note to clients.
5. Roku
Roku (NASDAQ:ROKU) is a streaming disruptor that has soaring stock and volume. The company has 19 million shares moving each day. Roku will partner with Kroger to use data to attract more customers. The move led Rosenblatt analyst Mark Zgutowicz to rate Roku stock a buy.
“Roku shopper data program, launched with one of the largest global grocery retailers, shows significant potential to alleviate friction between linear and CTV ad buys,” said Zgutowitz.
Roku’s stock rose 6% this year as more customers stayed home and canceled their cable subscriptions.
Roku stock
The high volume of Roku stock makes it a good buy for day traders.
Laura Martin is also bullish on Roku stock as more American viewers move from cable to streaming TV services.
“Roku had 45% (40 million of 88 million) of total connected TV homes in the US at 3/31/20, and therefore we believe Roku will be the winning aggregator of streaming TV and film content apps,” said Martin.
Analysis and patience key to day trading from home
To make money quickly from day trading at home, ironically, a lot of waiting is required. Building an effective trading strategy and studying the stock market is key. Working from home as a day trader can be a nice side hustle for beginners, but not a lucrative career to retire from in 30 years.
Despite what some traders on zero-commission apps may say, day trading is not a harmless get-rich-quick scheme. The stock market is cyclical and what goes up always eventually comes down. With TradingSim’s blogs, charts, and insights, day traders can learn more about how to withstand the unpredictability in the stock market to make money in the stock market.
Trading Strategy
Everybody wants to be a successful trader. While there are many strategies to become a successful trader, there are 10 pivotal ways that traders can have to build a winning portfolio. This TradingSim article will give traders the top 10 strategies on how to develop a solid trading strategy, highlight 5 specific investing strategies, and will assist investors who want to choose the best stocks or other investment instruments.
Why do investors need a trading strategy?
Investors need a trading strategy to avoid emotional investments. Trading strategies are necessary to avoid irrational actions during extreme swings in the stock market. It’s especially important to have a framework for trading during a bear market. Legendary investor Warren Buffett noted that investors have to remain calm to pick the best trading plan.
“Owners of stocks, however, too often let the capricious and often irrational behavior of their fellow owners cause them to behave irrationally as well, ” said Buffett.
Buffett added that an emotionless trading strategy is crucial.
” You need a stable personality. You need a temperament that neither derives great pleasure from being with the crowd or against the crowd because this is not a business where you take polls. It’s a business where you think,” added Buffett.
Having a trading strategy with predetermined rules that help investors make decisions help investors make the best choices. Here are 10 steps that will help formulate an effective trading plan.
1. Determine a trading goal.
When formulating an investment strategy, an investor should know what they want at the end of investing before they begin. If an investor has a set goal, it will give the investor more discipline to stick to them. For example, an investor may also want to set a short-term goal of buying a certain amount of shares of an in-demand stock, like Amazon(NYSE:AMZN). An investor may also set a long-term goal of increasing their portfolio by 15% over a year. A trading strategy will help an investor focus and reach that goal sooner.
2. Test a trading strategy
Once an investor has a plan, they can test it out. Backtesting a trading strategy could help test out the framework for a testing strategy. Using a simulator like TradingSim can help investors try out trading strategies before risking real capital.
Backtesting a trading strategy by analyzing the Dow Jones
3. Set aside a certain amount of time for a strategy
In addition to setting a realistic goal for trading, an investor must decide how much time they can dedicate to an investment plan. If an investor only has limited time to invest in the day, the quick action of day trading may be the best option. If investors want to take a long-term strategy, they can place trades for a longer period of time in swing trading. Investors can also determine a set time to invest each day to keep track of their investment goals.
The other key thing is making sure you spend the time to learn the basics of how to invest in the stock market with affordable introductory courses at a low price point. There is no point in spending a ton of money on anything related to the market until you feel this is something you are interested in over the long haul.
4. Determine which markets to trade.
Once a trader determines how much time to devote to trading, they should choose which market they will choose for investment. Traders may want to just focus on US stocks on the New York Stock Exchange or NASDAQ. For traders who want to explore other options, they can trade foreign exchange currency (forex) or futures.
5. Assess risk tolerance.
An investor must determine how much money they are willing to risk when placing a trade. Ideally, an investor shouldn’t risk any more than 5% of available capital.
Investors can determine a risk-reward ratio as well. A risk-reward ratio can be 1:3 if an investor has a $300 maximum potentially to lose and $600 maximum potentially to gain in investments.
Brandon Pizzurro, portfolio manager of public markets at GuideStone Capital Management in Dallas, noted that risk assessment is crucial, especially in this volatile stock market.
“Investing, in general, requires an assessment of one’s risk tolerance, and never is that risk tolerance tested more than in the midst of a bear market,” said Pizzurro.
6. Always have a stop-loss.
Traders should only risk what they can afford to lose. Instituting a stop loss will help investors stay withing their investing limits, especially in forex. A stop-order loss is a deal to sell a stock once it reaches a certain price. By setting a stop-loss, investors can limit their exposure to risk.
For example, a trader could be trading the euro and dollar at 1.1233. The trader could promise to sell the EUR/USD when it drops below 1.12. A stop-loss can set a limit on how much an investor loses on a trade.
“Whenever I enter a position, I have a predetermined stop [loss]. That is the only way I can sleep. I know where I’m getting out before I get in. The position size on a trade is determined by the stop [loss], and the stop is determined on a technical basis. I always place my stop beyond some technical barrier,” said Kovner.
7. Conduct thorough research.
In addition to having set limits with investing, conducting research is key. Investors can delve into a stock’s earnings report, price-to-earnings ratio, or track an investment on TradingSim’s charts. By conducting thorough research, investors can build a successful trading strategy. The TradingSim chart below shows the way investors can track Apple stock.
Apple stock
8. Have a trading journal
No, the journal isn’t to write about crushes. A daily trading journal can help an investor keep track of how the trades are going and how your plan is doing overall. A trading journal helps an investor keep track of what is working in a trading strategy and what doesn’t work. Trading journals should have these main aspects.
Date and time of trade. Keep track of when trades were made. Trades made in the morning may be more beneficial to investors than trades at different times.
Trace different instruments. An investor may have capital in different instruments, like commodities and stocks. Investors can track the performance of each different instrument to determine how their trading strategy works for each investment.
Entry and exit prices. An investor should keep track of the prices of stocks when they enter and exit trades.
Results of trades. Review the results of the trades. Investors can then go over successes and mistakes.
9. Learn from mistakes.
While checking a trading journal, an investor can notice a pattern in a trading plan-especially, when there are losses. An investor has to learn from mistakes to perfect their trading strategy. Forex trading expert Bill Lipschutz believes that losses are a natural part of trading and that investors can learn from trading losses and errors.
“I don’t think you can consistently be a winning trader if you’re banking on being right more than 50% of the time. You have to figure out how to make money being right only 20 to 30% of the time,” said Lipschutz.
“Poor risk management, for example, using too much leverage. Having a bad risk/reward profile on trades is a staple of poor risk management that I come across (as a rule of thumb a trader should not enter into a trade unless analysis suggests they can make at least ~$2 for every $1 risked),” said Rosenberg.
Knowledge of trading information is important. However, Rosenberg also noted that overanalysis can hinder traders as well.
“Over-complication of the analytical process. Many traders utilize too much information to arrive at decisions, which causes contradiction and indecisive behavior,” said Rosenberg.
An investor can learn what worked and what didn’t work from their trading strategies.
10. Keep trading.
Even if a trading strategy didn’t work, they can learn from their mistakes to continue as a trader. Investors can tweak their strategies or try a new one altogether. Traders shouldn’t get discouraged by losses. They should just re-assess their strategy and stay in the investing game. Investors should stay encouraged by remaining confident and treating investing as the serious business that it is.
Different trading strategies can lead to success
There are many different trading strategies that investors can use. Some of the most popular plans will be explored with the steps mentioned in this TradingSim article.
Day trading can be successful for traders who want quick stock action
Day trading is a popular trading strategy for investors want to make a lot of quick trades- and possibly profits- every day. Short-term trading is the essence of day trading.
Owen Murray, director of investments at Horizon Advisors, notes that day trading may pay off most during a bull market because there are greater profits.
“Day trading typically becomes very popular during bull markets, because on balance, stocks are mostly moving higher and it is easier to make profits,” said Murray.
How to have a better day trading strategy
Day trading can work for traders in a bull or bear market if they take the right precautions. There is no one right way to day trade. However, using the above steps can help create a successful trading strategy. As mentioned in an earlier TradingSim article , investors must treat day trading as a business. Day traders can take these steps to be a more successful trader.
Day traders want to make profits s quickly, so they can set a goal of trading 5 stocks or so a day. As a trader’s confidence and track record grow, they can make dozens of trades a day. However, Merlin Rothfeld, an investment strategist, advises against making so many trades in such a hurry.
“When I started day trading back in 1998, I was a total gunslinger, averaging 550 trades per day,” said Rothfeld. “This caused me to be reckless in my trade selection and execution – not to mention that my broker was making a killing off the commissions I was paying on all those trades. “
“For this reason, I recommend that every day trader set a maximum number of trades to take in a day. Think of it like having a six-shooter: You only have six bullets in your gun, so you better make them count,” added Rothfeld.
Have the capital set aside for day trading.
While day traders may crave the excitement of making lots of trades, they must have the money to make the trades. Day trading is usually the most costly investment. The capital required to trade stocks could climb up to $25,000. Trading futures and commodities like oil may only require about $1,000 to invest in the stock market. The forex market may require about $1,000 or even less. There is no set amount for investing, but day traders shouldn’t risk more than 1% of their capital on trades.
Set aside a lot of time for trades.
Day trading happens quickly all day, so day traders have to be ready to trade at a moment’s notice. Traders must treat day trading as a second job and dedicate hours a day to tracking trades.
The best time to trade could possibly be when the market opens from 9:30 AM-11:30 AM EST. The first two hours of trading are often the most active, so day traders have the potential to earn the most money. The best time to trade futures is usually in the morning as well. Forex can be traded 24 hours a day because of the global trading around the clock.
Test day trading strategies often.
If traders want to try out their strategies before investing capital, backtesting day trading could be best. Day trading strategies can be tested on TradingSim before they’re implemented in real life. Simulated trades can help traders analyze how well or badly their trades are doing. Testing out trades can help determine which strategy is best for day trading. For example, if an investor wants to backtest day trading Coca-Cola stock, they can use charts like the TradingSim chart below.
Coca-Cola stock
Conduct up-to-the-minute research.
Since day trading is so volatile, it’s important to remain on top of financial news. By following blog posts on sites like TradingSim, day traders can stay informed on the latest financial news to make better-informed trades. Day traders should also have an up-to-date trading journal to keep track of the many trades that made.
Have stop-losses to minimize risk.
Stop-losses are important to stay ahead in trading. Kenny Polcari, senior wealth strategist at SlateStone Wealth, noted that it’s important to change course, change position size, and cut losses when necessary.
“Don’t get married to a position just because you like the name. Don’t be married to it if it’s going in the wrong direction. You’ve got to be able to cut your losses and then look at it again at a different time,” said Polcari.
Dennis Dick, proprietary trader and market structure analyst at Bright Trading, notes that it’s important to minimize risk since day trading is one of the most unpredictable trading strategies.
“The goal is to try to eliminate the overall market risk, which is essential in the current market environment,” he says. “Even if a stock has good relative performance, if the overall market has a significant decline, I am likely to lose money on that trade.”
A stop-loss order on a certain stock price will ensure that investors won’t risk more than necessary while making day trades.
Practice and dedication build better day traders
Research, patience, and limiting losses are key to being a successful day trader. Trader Deyanna Angelo noted that day trading is not an easy way to get rich.
“Day trading is a very difficult performance discipline, much like becoming a professional football player or playing a musical instrument to a virtuoso level. You first need to have a natural talent, followed by years of practice,” said Angelo.
Swing trading strategy an option for investors
In addition to day trading, successful trading plans can be applied to swing trading. Swing trading is a trading strategy in which investors strike during two major swings in the stock market. They enter or exit trades when the market swings high or low. In a bull market, swing traders can go long and trade at highs. In a bear market, swing traders can go short and sell when stock prices plunge.
Swing trading is similar to day trading, because an investor holds a stock for a short period of time. However, while several day trades could be placed every day, swing trades could be placed every few day or weeks. Investor Evan Medieros noted that traders should minimize their risk while swing trading stocks.
“I risk anywhere from 0.50 to 1% per trade. Position sizing and managing individual trades include stop losses, both timed & price,” said Medieros.
Similar to day trading, Medeiros noted that he has a series of stocks ready to trade over a few days.
“At any given time, I have 50 to 100 stocks on my bench that I want to get involved in once they ‘set up’. So it is a combination of waiting for the setups and aligning that with my target portfolio exposure, given the market environment, “said Medieros.
Best time of day to swing trade may not be at opening bell
As opposed to day trading, the best time of day to swing trade may not be when the stock market opens at 9:30 EST. At the opening bell, stocks generally move higher, so that may not be the best time for swing trading. When there is a pullback between 10AM-11AM, that may be the best time for swing trading.
Use swing trading indicators
There are three main swing trading indicators that swing traders can use to monitor stocks.
Moving averages
Moving averages help investors identify or confirm trends. In a simple moving average, all the closing prices are added up for a certain number of days. After the addition, the total is divided by the same number. For example, a 10-day moving average would take the closing price of the last 10 days. It would then be added up and divided by 10 to get the average price.
10 -day moving average
2. Relative Strength Index
The relative strength index (RSI), which helps determine if the stock market is overbought or oversold. The RSI is on a chart of 0 to 100. The market is considered overbought if the RSI presents any number over 70. If the price is below 30, the market is considered oversold.
3. Visual analysis indicator.
Visual patterns on charts can help investors easily keep track of what is happening in the stock market.
With indicators and risk management, investors can make the best of swing trading. While day trading isn’t for every trader, with research and persistence, investors can try day trading as a method to potentially increase profits.
Scalping trading strategy another option for investors
In addition to switch trading, scalping trading is another short-term trading strategy that investors can use. It’s similar to day trading, but differs in an important way. Scalping make numerous trades for smaller profits. Scalping traders can profit from small price changes. Instead of holding positions for a few hours or weeks, scalpers may just hold a position for just a few minutes.
Small goals and a lot of time are key to scalp trading
Scalping is about getting smaller profits faster, so incremental goals are pivotal. Traders should start by looking for gains in the range of $0.10-$0.25.
Scalping is such a high-volume trading strategy that quickly changes. So, scalpers need a lot of spare time to monitor the markets. Watching the stock market for hours is a must to catch any slight price changes.
Scalping trading strategy has low risk, but requires high wins
A benefit of scalping is that it is low risk. However, a trader must have a higher number of wins because the profit margin is so minuscule. Traders need a large amount of capital to enact dozens or even hundreds of trades.
Traders should make sure the risk/reward ratio is 1:1. As noted in a previous article about scalp trading, a trader shouldn’t risk more than .1% of their capital on a trade.
If an investor’s trade position is $100 and the stop price is $99.50, the risk and reward must equally be 50 cents. The trader should exit a trade at $100.50 to turn a profit.
Technical analysis can help scalpers
Scalpers can hone their scalping trading skills by using technical skills. Just as moving averages can help with swing trading, they can be useful with scalp trading as well. The simple moving or exponential moving average indicators show the average stock price over a particular time. The exponential moving average may be better for scalpers because it monitors price changes quicker than simple moving averages.
The Stochastic Oscillator Indicator is another way to monitor momentum. Traders use the Stochastic to predict the momentum before a price change. The Stochastic Oscillator and the exponential moving average are just two methods to analyze stocks for scalp trading.
With analysis, a lot of time to invest, and interest in incremental gains, traders can test out the scalping trading strategy.
Position trading strategy is a long-term option for traders
In contrast to scalping, long-term investors that want a longer-term trading strategy can try position trading. Short-term trading can last for minutes or hours. However, position trading can stretch for weeks, months, or even years. Position trading is a long-term stock market trading strategy in which traders want to catch long-term trends in the market.
Position trading strategy may be best for passive traders
Traders that don’t have a lot of time to invest-and more-capital- could try the position trading strategy. For traders that want to more closely emulate long-term investing, position trading could be a better option. Some position traders may just place a few big trades a year, so they can trade part-time if they want. Beginning traders that want to gently wade into trading may find position trading best for them. Position traders hold positions for a longer period of time, so more capital is required to invest.
Bear market may be good time for position trading
Ironically, a bear market may be a better time to try position trading than in bull markets. In a bull market, positions may eventually tumble in a correction. A trader placing positions at the end of a bear market may be in a better position when the stock market eventually recovers. If a position trader is patient and rides out the end of a bear market, they could potentially profit when a bull market comes around again.
Specialized position holding is key
Because a trader is holding a position for a long time, it’s pivotal that position traders have specific holdings. If a position trader focuses on one or two sectors to follow, like tech or healthcare, it will be easier to spot trends.
Position trading uses many research tools
Position trading takes a long-term view, so traders can use two types of analysis. Traders can use fundamental analysis to study earnings reports of stock and overall market trends to determine how to trade.
Position traders can also use technical analysis to monitor their positions. They can use the 200-day exponential moving average to identify long-term trends. It could possibly be a bullish signal when a price of a market rises above the 200-day average. Traders can watch the 200-day exponential moving average to determine where the market is trending.
Traders that have patience and want to minimize risk may find that position trading is the best option for them.
Trend trading may be best for long-term investors
Similar to position trading, trend trading is ideal for traders who want to hold positions for a long time. Trend traders look at a stock’s price trend over a long period of time. A trader then compares the price to broader market trends. An investor then makes a trade based on that knowledge about the market trends.
Legendary trader Paul Tudor Jones noted that the 200-day moving average indicator is important to monitor trends. Trend trading can use the 200-day moving average indicator to watch assets.
“My metric for everything I look at is the 200-day moving average of closing prices. I’ve seen too many things go to zero, stocks, and commodities. The whole trick in investing is: ‘How do I keep from losing everything?’ If you use the 200-day moving average rule, then you get out. You play defense, and you get out, ” said Tudor Jones.
Trend trading requires fewer trades
Google stock the week of March 19
Similar to position trading, few trades are required to start trend trading. A trend trader could just make about a dozen trades a year to remain active.
Because turtle trading is a slow and steady process, trades can be made at any time. There is no rush at the beginning of the day like day trading. There is also no need to wait for a pullback later in the trading day, such as with swing trading. Whether it’s at opening bell in the US stock market or after-hours with forex, turtle trading has a flexible timetable.
“The trend is your friend” in this trading strategy
Financial adviser Ali Hashemian noted that trend trading may be best for trading commodities like oil or gold. The trends in those commodities may be easier to track than stocks, so trend trading may be best for commodities.
“Trend trading is commonly utilized by commodity traders. Most often this trading style will include price calculations, moving averages, and take-profit or stop-loss provisions. Traders will use price movement and technical tools to determine trading signals,” said Hashemian.
Trend trade signals and indicators help traders make best picks
A number of different trade signals can be used, and traditionally there are set rules and risk controls put into place when using this trading strategy. Other than the moving average, there’s the Moving Average Convergence Divergence (MACD). If the MACD moves above 0, that’s usually a sign to buy. If the MACD moves below 0, that’s usually a bearish sign for trend traders to sell their assets.
The aforementioned relative strength index (RSI) signals a buy trend if it moves above 50. An on-balance volume indicator can be used to measure an asset’s trading volume. Joseph Granville, the developer of the metric, believed that an increased volume in an asset means a bullish or bearish turn.
Risk management key to trend trading
Famed trend trader Paul Tudor Jones also advises having a “5:1 risk /reward. Five to one means I’m risking one dollar to make five. What five to one does is allow you to have a hit ratio of 20%”, said Tudor Jones. Minimizing risk is key to get ahead in trend trading. A maximum 2% stop is also advisable for beginning turtle traders.
Turtle trading is most famous form of trend trading
Turtle trading is the most famous form of trend trading. The popular method emphasizes a purely technical and methodical approach to trades. Financial analyst Zaheer Anwari noted that turtle trading can pay off if traders are patient and emotionally detached while making trades.
“With time and experience, it becomes a detached, robotic and stress-free approach to the markets, as the initial risk is always very low and well managed and only the very best trades are taken,” said Anwari.
Turtle trading could be best for traders who want to bide their time in the markets. The turtle trading strategy could also work traders who want or need set trading rules.
Different trading strategies can help create success
There is no one trading strategy that will create a successful framework for a trading strategy. Just as the stock market is different every day, so is a trader. What may work one day may change the next. However, the 10 steps and specific trading strategies will help traders make better choices.
TradingSim’s charts and articles can help beginning or experienced traders develop the best trading strategies to navigate the volatile stock market. With a methodical framework that makes room for flexibility, traders could find a trading strategy that works best for them.
![Three White Soldiers: 3 Things You Must Consider Before Trading [Video]](https://app.tradingsim.com/wp-content/uploads/2021/06/Three-White-Soldiers.png)


![8 Best Bearish Candlestick Patterns for Day Trading [Free Cheat Sheet!]](https://app.tradingsim.com/wp-content/uploads/2021/06/image-60.png)