Four Advanced Entry Techniques for Liquidity Traps

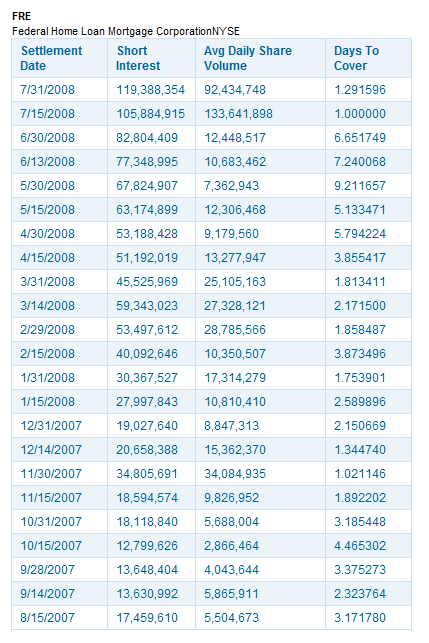
In recent months we’ve seen a number of liquidity traps showing up as a result of the “dead cat” bounces from oversold conditions in many stocks. We’ve written fairly extensively on this setup before. So if you haven’t read up on the liquidity trap basics, be sure to do so, along with our explanation of Days to Cover. In this post, we’re going to dive a little deeper and uncover some more advanced entry techniques for liquidity traps.

What are liquidity traps?

We’re not going to spend much time here, because we assume you’ve taken the time to read the articles linked to above. However, as a brief reminder, liquidity traps can a very explosive and profitable strategy when trading lower float, lower priced stocks.

The concept revolves around a large volume day, usually a high-volume gap up. Because these stocks gap so frequently, they become prime targets for short sellers. More often than not, the large gaps end up being what many day traders refer to as a gap and crap scenario.

Usually, these are companies that bleed cash and hire PR firms to pump their stock to retail traders, only to sell more shares into the pump. This dilutes the company, obviously. It happens over and over again in the market. To learn more about it, be sure to watch our recent SimCast episode with Rick Analog.

Often times, one to many gaps that fail trains short sellers, like Pavlov’s dog, to slam the bid on day one. Fast forward a few days, add in a million more retail traders than prior years, and you’ve got a recipe for a fast 2-3 day short squeeze.

Here’s a liquidity trap example:

Example of AACG liquidity trap

Notice a few things here. One, you’ve got a big selloff from the prior high volume day noted on the chart. Two, you have another “pump” day. But then, things get interesting.

In day 2 and 3 of the most recent pump, you get diminishing volume characteristics while price remains elevated. By the fourth day, shorts are in hot water as price breaks to a new high there, enough for a move from $2 to $3. That’s a huge move!

It’s the anticipation of the big secondary move that we call a liquidity trap setup. But how can we zoom in and find our best entry? That’s the question we seek to answer in this tutorial.

Advanced Entry Techniques for Liquidity Traps Using the VCP Strategy

Using the example of AACG above, let’s zoom in on a 15 minute chart and see if we can find the Volatility Contraction Pattern. This should allow us to set our risk levels off of “higher lows” in the formation.

AACG advanced VCP entry techniques on 15m chart
AACG advanced VCP techniques on 15m chart

As annotated on the chart, we have the initial run, like a flag pole. Then we have consecutive pullbacks that get tighter and tighter while maintaining key support levels. It’s our job to find an area to risk to in anticipation of a breakout.

The question will be, what happens on the current pullback, the 4th pullback. But let’s not jump the gun. Let’s use more technical analysis to help us time our entry.

Using VWAP Boulevard and Support/Resistance Lines as Advanced Liquidity Trap Entry Techniques

Now that we have some indication of a potential setup. Let’s look more in depth at the key levels on the chart.

One way to do this is using the concept of VWAP Boulevard. We’ve written an ultimate guide on this subject, thanks to the education efforts of @team3dstocks on Twitter. Be sure to check out both links if you aren’t familiar.

Applying vwap boulevard to our 15 minute chart and daily chart, we gain insight as to where the majority of the stake holders are present. This gives us clues as to where the “whales” might be supporting either their long or short positions. It also might represent who becomes the bag holder, and where that line is drawn.

VWAP Boulevard Support Lines on Daily Chart

In TradingSim, we’ve built a vwap boulevard drawing tool that allows you to select a range of candles from dates that you want. Here, we’ve selected only the closest candles to the recent high volume day. The key level for the highest volume day is 1.91.

Just a quick glance at the chart allows you to see that this remained a key support/resistance level in the days to follow. It’s a great way to manage risk over/under.

We’ll leave this drawing up, then head back to the 15 minute chart to see how these levels correspond.

VWAP Boulevard On Lower Time Frames for Advanced Liquidity Trap Entry Analysis

Coming back to the 15m chart of AACG, you’ll notice that we’ve left the key vwap boulevard lines from the daily chart, but have also drawn a second set of vwap boulevard lines based off of the 15 minute bars. This gives a bit of insight into the more granular “control lines” intraday.

Using vwap boulevard lines for advanced entry techniques in liquidity traps

Interestingly enough, the two black lines which represent the closing vwap of the largest volume candles create the channel for AACG’s consolidation. Why is this so cool? It gives you an idea of where to risk for long or short.

If you’re wondering what the other pinkish lines represent, they are vwap boulevard lines also — but not for the most significant volume candles.

So far, we’ve seen that we can use a volatility contraction pattern and vwap boulevard to help us build our advanced entry techniques for liquidity traps. Now, let’s look at the volume and price analysis.

Using Intraday Swings and “VooDoo” as Advanced Entry Techniques for Liquidity Traps

No, we’re not talking about black magic or dark arts here, even though it might seem like it the more you see Volume Dry Up into these patterns. This lack of supply often precedes large moves as shorts begin looking around wondering when their reinforcements are going to arrive.

We’ve written extensively on pocket pivots and vdu (“voodoo”) thanks to Gil Morales’s teachings. They go hand in hand with consolidation patterns like volatility contraction patterns. For that reason, let’s apply them to our AACG chart and see what we can glean for another advanced entry technique in this liquidity trap.

Advanced entry analysis with vdu and pocket pivots

We’ve left the vwap boulevard lines up, zoomed in just a little, drawn a descending diagonal trendline, and thrown in annotations for VDU and Pocket Pivots. Pay close attention to how the fourth day has a quick washout at the open. This then finds support at vwap boulevard yet again.

After the rally, we pull back into the body of those significant rally candles and find support on a higher low. Most importantly, volume diminishes during this pullback. As shorts begin to realize the impending squeeze, it leads to a pocket pivot of demand up and out of the trading range.

We test the upper vwap blvd briefly, then break to new highs.

Advanced Entry

You might be asking, where would I enter the stock long?

Using these advanced entry techniques, you could have entered long as the morning washout reclaimed the lower vwap boulevard level. We’d call this a spring move. Your risk would be set below that wick.

If you missed that entry, you might consider the pullback. We like to time our entries as volume moves from vdu to pocket pivots, risking the most recent vdu lows. In this case, you’d go long around $2.00-$2.05, risking just below $2 or $1.91 depending on your risk personality.

Analyzing Intraday Swings for Advanced Entry

We’d like to touch on one other technique for advanced entry in liquidity traps, and that’s intraday swings. Intraday swings are essentially the prominent trends that form throughout a consolidation in a stock.

Using the 15 minute chart, what we notice, in addition to the higher lows, is that the stock is losing its downward momentum over time. In other words, the slope of each downward swing is less and less. Take a look:

Diminishing intraday swing slope analysis

What this tells us is that the big picture could be bullish in the intermediate timeframe. If each day represents the force of supply, then it’s safe to say that supply is waning into the apex of the consolidation. This is typically bullish.

As traders, it is our job to consider this context as we anticipate and build a thesis behind a trade. It gives us the detail, along with all the other components of the structure that we’ve examined, that bolsters our conviction for the entry.

Conclusion

We hope this has helped you with the broader framework behind choosing a “setup.” Sometimes it’s as simple as seeing a pattern and pushing the buy button. But we think that the more boxes we can check with analysis, the more confident we can be in our trade.

Advanced early entry techniques like these provide opportunities for low risk, and higher reward. With enough backtesting of these strategies in the simulator, you may find your own niche. Breakouts can then become add-on points instead of high risk entries.

As with any strategy, it’s always best to test it in a simulated environment and track your results before putting real money to work

Here’s to good fills!

days to cover banner

Definition of Days to Cover

Days to cover is a formula which tracks the number of shares short in the market relative to the available float.  This allows a trader to see how bearish or bullish traders are on a security.  The last component of the ratio is the amount of daily volume. 

If you know the number of shares short and compare that to the average daily volume, you can estimate how long it would take for the short sellers to exit their positions.  This ratio gives a trader a rough estimate of how much buying pressure is present in the market for a security. It also gives an indication of potential liquidity traps, which can lead to huge short squeezes.

Formula for Days to Cover

The below formula displays how to calculate the days to cover ratio:

Days to Cover Formula

Where to find Short Interest Data

Short interest data is tracked daily by the major exchanges, but is only released bi-weekly to the public.  One of the best places to find the days to cover data is http://www.shortsqueeze.com/. The site has a simple tool that works like a ticker where you type in a symbol and it returns the days to cover information and a number of other ratios.  The beauty of this is you do not have to go to multiple websites to get the days to cover information from each exchange.

Many brokers will also share this information. For example, a free WeBull account shows the short interest and days to cover as a graph, like this:

Days to Cover and short interest from WeBull

This chart shows the days to cover on the left, and the actual number of shares short on the right. This, of course, is only updated twice per month. For that reason, it’s best to consult a chart and consider more recent volume and price action.

How to trade with Days to Cover info

The days to cover does provide some insight into the relative strength of a potential short squeeze. 

Stocks that have double digit days to cover ratios are often prime targets for speculators.  But, traders have to realize that every stock that has been beaten appears ready for a bounce.  To simply look at the days to cover ratio and buy the stocks with the highest number is a recipe for disaster. 

Traders have to not only look at the ratio, but also the technical formation which precedes your entry.  If you see climatic volume and a sharp price reversal, odds are you may have a good entry.

Short Interest Table

Below is a historical short interest table for Federal Home Loan Mortgage Corporation (FNM).  Notice how the stock had a days to cover value of 9.21 at the end of May which ultimately led to a swift sell off.

Days to Cover Table
Days to Cover Table

AMC Short Squeeze Example

Short squeezes are more likely to occur on small cap stocks than large caps. That doesn’t mean that large caps are immune to short squeezes, it is just that large caps need significantly higher pressure to squeeze the float (number of outstanding shares).

That being said, AMC was one of the more famous short squeezes recently, along with GME and SPRT. Let’s walk through a short squeeze example where AMC rapidly shifted from a bearish to bullish sentiment.

AMC short squeeze
Short Squeeze

This is the daily chart of AMC in 2021. Now have a look at the historical short volume in AMC for early 2021:

AMC short interest
AMC short interest

If the print is too small, the spikes in February and March coincide with around 100+ million shares short. Compare this with the corresponding spikes on the price chart shared above. Here is a nice overlay view:

Overlay of short volume and AMC chart

Now, if you consider that AMC has around 450m shares in the float, the compounding effect of 100s of millions of shares short can add up quickly. If price never recedes to allow these shorts the ability to cover over time at lower prices, the effect can be devastating.

Assuming that there were a couple hundred million shares short before the squeeze, the average daily volume before that period was around 40 million shares. Using our formula above, that gives us about 5 days to cover. Sure enough the upward momentum of the squeeze lasted about 6 days total.

Granted, all of this has to be pieced together unless you have access to real-time shorting data.

And from the results above, you can see that there were plenty of shorts to fuel the demand behind the squeeze from $10 to $70.

SPRT Short Squeeze Example

SPRT was another fantastic example of a short squeeze with high days to cover in 2021. Notice that the Days to Cover reached about 8 days back in May of 2021, while short interest was steadily climbing upwards of 3m shares or more.

SPRT days to cover and short interest data from WeBull

As the short interest rose, at one point it reached at least 78% of the float according to research done by Benzinga at the time.

Benzinga.com article excerpt

As you can imagine, the stock was poised for a short squeeze. However, we need to see the chart to really time our entries. Let’s go back and look at SPRT from this time period:

SPRT with high days to cover and huge short interest

Compare this chart of SPRT with the AMC chart above. Notice how we get a huge volume increase, then liquidity dries up considerably. This is a big indicator of whether or not a stock with a high short interest has “time” enough to let shorts out of their positions without exponentially moving the price of the stock.

As price rises, you’ll often see the shorts “averaging up” with daily candles that appear to be huge selloffs. But if the watermark gets too high, the shorts are stuck and forced to liquidate.

Finding Short Squeeze Candidates Using the Liquidity Trap Concept

We’ve written extensively on this topic in another post, but we thought it worth mentioning here that some short squeezes don’t take as long to “build”. There are times when low float stocks ramp up on huge volume, sell off, then squeeze right back up in a matter of days.

Take a look at these few examples and see if you can piece together the liquidity trap and sudden increase in days to cover — without actually having seen any days to cover fundamental data.

WHLM Liquidity Trap
WHLM liquidity trap in 3-4 days
KPLT shorts get stuck the first day as days to cover increases
KPLT liquidity trap

Hopefully you can see the concept. A great way to search for these is to scan for stocks that gap up on heavy volume and low float. Keep them on watch in the days after to see if volume recedes, then picks up again.

Other Ways to Find Stocks Ready to Pop

Short squeezes are difficult to identify by simply looking at a stock chart.

You can always analyze the short interest of a stock and the days to cover; however, you will never be sure when a short squeeze will occur.

For this reason, you can look to technical indicators to confirm potential short squeezes.

Oversold (Overbought) Indicators

Identifying technical indicators with reliable oversold readings is the most useful tool for identifying short squeezes. Oscillators are a great type of leading indicator as they provide oversold readings right before the positive price action.

Some indicators which provide oversold readings are:

  • Stochastic Oscillator
  • Relative Strength Index (RSI)
  • Commodity Channel Index (CCI)
  • Rate of Change (RoC)

Short Squeeze Trading with the Stochastic Oscillator

The stochastic oscillator consists of two lines which are floating in and out of an upper, mid, and lower area.

When the two lines enter the oversold area, we have a potential buy signal. A long trade can be opened when the two stochastic lines cross and exit the oversold area.

Since we are trading a short squeeze, we need to attain oversold signals from the stochastic. Let’s see how the stochastic could have been applied in these two short term squeeze examples:

Short Squeeze and Stochastics

Notice that during the period when the short interest was increasing, the stochastic lines cross downwards and exited the overbought area.

After entering an oversold condition, the two lines began to trend upwards.

Three days later, we get a bullish explosion of 16.4% for one day and a further expansion to 20%.

Let’s now apply the stochastic to the other example:

Short Squeeze and Stochastics 2

Again, we have the stochastic oscillator at the bottom of the chart.

While the short interest was increasing, the stochastic lines were also decreasing.

Then the two lines entered the oversold area. After tracking the price action for a few days, once the lines exited the oversold area, we bought MN.

Two days later a short squeeze ensued. MN experienced a strong bullish move where the price increasing 21% in two days.

Short Squeeze Trade Management

Trying to time a short squeeze will be one of the most challenging jobs you find in the market.

The reality is that stocks often have a high short interest because they are crappy companies and the stock price is likely to go lower before making a run.

Think about it, you are in essence trying to catch a falling knife in the hopes of catching the pop.

As we have said many times, in equity trading, you will never be right 100% of the time. We have also shown you profitable trading strategies with only 20% success rate. Short squeeze trading should really be no different than your normal trading. There needs to be a setup there technically, despite the underlying days to cover and short interest fundamentals.

Short squeeze trading can be profitable as the moves are so violent to the upside and there is no limit on how far the stock can run.

Stop Loss

The one good thing about trading short squeezes is that you can keep tight stops.

When you enter a trade on a potential short squeeze, you should put your stop below an area of support. Always keep in mind your risk to reward when setting a stop.

Target

This is the tricky part.

Your targets on short squeezed stocks will be somewhat extended. Did you notice that in the two examples above we had a 20% price increase for both? Not to mention that AMC and SPRT more than tripled!

In most of cases a successful short squeeze will lead to a price increase above 15% on small cap stocks, minimum.

However, what are we going to use as a signal in order to exit the market?

The stochastic oscillator will do the heavy lifting when determining your exit.

Simply stay in your long trades until the stochastic enters the overbought area. Do not wait for a line crossover in a bearish direction. Just wait for the lines to enter the upper area and to close one period.

Otherwise, hold for potential climactic action on the daily chart.

Doing the Math

Let’s say you invest $1,000 in each of your short squeeze trades. At the same time, your system has only a 10% success rate. You risk 0.5% in each of your trades. We will take a minimum target of 10% for our trades.

Below is a breakdown of the math:

  • $1,000 x 0.5% = $5 (loss)
  • $1,000 x 0.5% = $5 (loss)
  • $1,000 x 0.5% = $5 (loss)
  • $1,000 x 0.5% = $5 (loss)
  • $1,000 x 0.5% = $5 (loss)
  • $1,000 x 0.5% = $5 (loss)
  • $1,000 x 0.5% = $5 (loss)
  • $1,000 x 0.5% = $5 (loss)
  • $1,000 x 0.5% = $5 (loss)

= 9 x 5 = $45 loss from 9 trades in a row.

  • $1,000 x 10% = $100 (profit)

So, with 10% success rate and a relatively low target of 15%, we are likely to generate:

100 – 45 = $55 profit per 10 trades.

Please note you have to be ok losing 9 trades in row.

End to End View of a Short Squeeze Trading Strategy

Let’s now wrap up all rules of the short squeeze trading strategy in one example:

Short Squeeze Trading Example

This is the daily chart of Era Group. The image shows a short squeeze scenario.

Era Group is in a selloff leading into the end of February. At the same time, the Nasdaq is reporting 6 days to cover.

The green circle on the chart shows the long signal we receive from the stochastics.

We immediately enter a long trade at $6.97 per share and we place a stop a bit below this point, since it is the lowest on the chart. Our stop is at $6.94 per share which is 0.43% below the entry price.

The price starts increasing rapidly right from the moment we entered the market.

The first candle during our log trade is huge. At the same time, the stochastic is increasing as well. Three periods (days) after we entered our trade, both stochastic lines cross into the overbought area. This is our closing signal and we exit our trade.

We were able to catch a 51% increase on this trade – unbelievable!

So, investing $1,000 in this trade we would have generated profit equal to $501, while risking $4.3. The trade lasted for three days. The risk to return ratio of this trade is huge!

Please remember, these cases are extremely rare!

Conclusion

  • The days to cover is a ratio which displays how many days short sellers need to cover their positions.
  • Days to cover is calculated by dividing the current short interest / average daily volume.
  • Days to cover helps determine if a stock is a likely short squeeze candidate.
  • We have a short squeeze when short sellers cover their trades and create extra buying pressure.
  • Short squeezes can lead to huge price jumps.
  • An oscillator could be helpful when looking for short squeezes.
  • When you trade short squeezes you will usually have 10% – 20% success rate.
  • When you trade short squeezes, you can aim for increases around 15%.
  • You will usually risk about 0.5% of your investment per trade.
  • Sometimes, anomalies could occur, where the price increases significantly as illustrated above; however, these cases are extremely rare.