The Shooting Star Candlestick Pattern: Raining Profits From The Heavens

Shooting Stars

The shooting star is a single bearish candlestick pattern that is common in technical analysis. The candle falls into the “hammer” group and is a first cousin of the – hanging man, hammer, and inverted hammer. If you’re unfamiliar with any of these patterns, check out our Quick Reference Guide.

Our trading expert, Aiman Almansoori describes these patterns and how to trade them in a fantastic webinar. Be sure to follow our YouTube channel to watch more educational content like this.

What is the Shooting Star Candle?

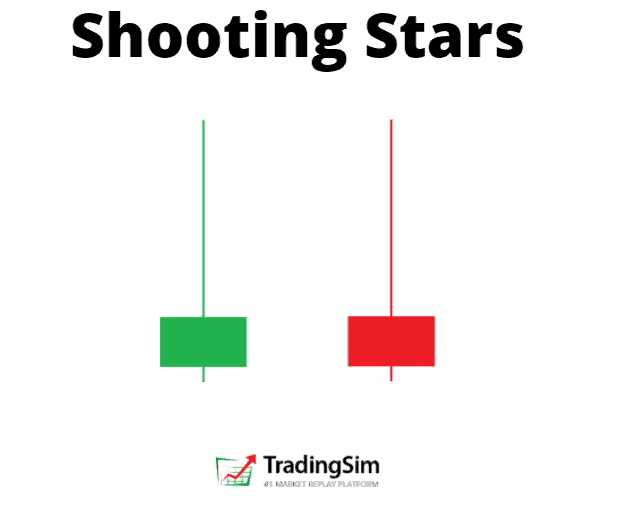
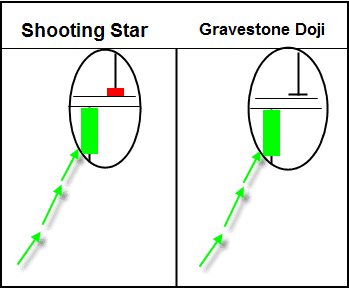
The shooting star has a small body and a very long upper candle wick.

As you see, the candle has a small body located in the lower part of the pattern.

Shooting Star image

However, this also looks like an inverted hammer candle pattern.

So, how can we distinguish the two? The answer to this question is hidden in the price direction before the creation of the candle.

Inverted Hammer

The shooting star candle is a reversal pattern of an upwards price move. The inverted hammer occurs at the end of a down trend.

Shooting Star Confirmation

If a stock is in a bullish uptrend and you identify a shooting star candle, then there is a solid chance that the trend will reverse. For this reason, traders use this candle to enter short trades on the assumption that the bullish move is running out of steam.

shooting star candlestick potential

Once you are able to identify the shooting star, you should look to open a short position on a break of the low of the candle.

The expectation for the profit potential for the shooting star is 3:1 the size of the candlestick.

Here is an example with AMC. Note that we are aiming for 3x the width of the shooting star candle:

AMC bearish candlestick pattern
AMC bearish shooting star candlestick pattern

Psychology of the Pattern

The shooting star candlestick is considered one of the most reliable candlestick patterns. One of the reasons for this is the unique structure – a small body with a high upper candlewick.

The psychology of the trade has many layers of complexity.

First, buyers are enjoying their gains as the stock shoots to a climactic high.  As this euphoric moment begins to set in, short traders begin to sell the stock on a flurry of buy orders.

At this point, the longs who were late to the party begin to get scared and start to sell out as well. This panic long selling and short selling leads to a sharp reversal in the price action, thus generating a small candlestick body on the chart.

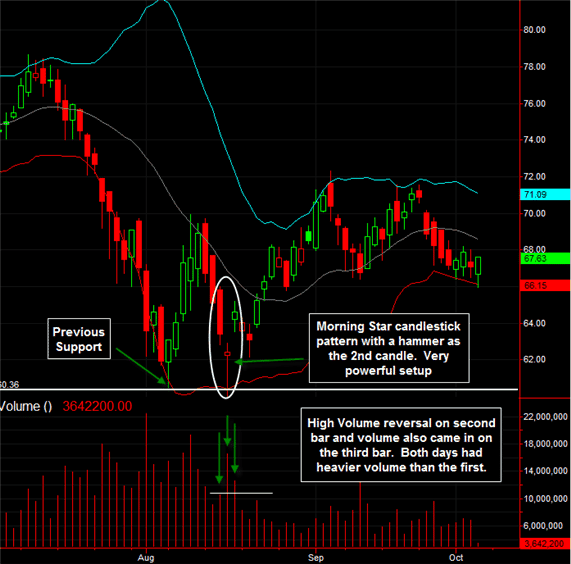
It is important to mention that the shooting star candlestick pattern is even more reliable when it develops after three consecutive bullish candles.

This creates exponential bullish pressure on the chart. In other words, exhaustion.

In such cases, the shooting star candle is likely to have an even bigger upper candlewick. This implies that the price is about to reverse with even bigger strength.

3 Steps to Trading the Shooting Star

1)    Trade Entry

Before entering a shooting star trade, you should first confirm the pattern.

Here are handful of criteria to ensure success:

  1. Identify an active bullish trend.
  2. Spot a candle with a small body and a big upper candlewick.
  3. Wait for a bearish candle to break the low point of the shooting star body.
  4. Ensure elevated volume, signifying heavy supply
  5. This will confirm the validity of your shooting star on the chart.

If you are able to identify the presence of these signals, then you should short the security. After all, you are anticipating an upcoming bearish price move.

2)    Stop Loss

You should always use a stop loss order when trading the shooting star candle pattern. After all, nothing is 100% guaranteed in stock trading, and you may experience false signals when trading the shooting star pattern.

For this reason, place the shooting star candle pattern above the upper wick of the pattern.

3)    Taking Profits

The price target for the shooting star is equal to the size of the pattern (the length of the candle).

Similarly, our target is for a price move equal to three times the length of shooting star, including the wick.

Shooting Star Trading Strategy

Now that we have the shooting star confirmation criteria behind us, we will combine these three basic steps into a trading strategy.

Example #1

This is the 2-minute chart of Hewlett-Packard from June 10, 2016. The image illustrates a classical shooting star trading example.

trading strategy
shooting star trading strategy

Our trading analysis starts with identifying that the price is trending upwards.

Suddenly, a shooting star candlestick appears, which is marked with the green circle on the chart. We have a small candle body and a big upper candlewick, which confirms the shape of the pattern.

Entry

The next candle after the shooting star is bearish and it confirms the pattern.

Therefore, we sell the security after the pattern confirmation. At the same time, we place a stop loss order above the upper wick of the shooting star candle in order to secure our short trade.

This way, if the price creates an unexpected bullish move caused by high volatility, we will be protected.

Our maximum loss will be equal to the distance between the level we short HPQ and the level of the stop loss order.

The first blue arrow on the image measures the size of the candlestick. According to our shooting star trading strategy, we should seek a target equal to three times the size of the pattern.

Profits Raining

Thus, we apply the size of the pattern three times starting from the lower candle wick. This is how we get the big blue arrow, which points out the minimum target of our trading strategy.

trading strategy
shooting star trading strategy

In order to maximize our profits, we need to stay in the trade until the price action closes a candle beyond the minimum target.

On the way down, the price creates one correction during the bearish move. The downward activity then resumes and 18 periods after we short HPQ, the price action closes a candle below the minimum target of the pattern.

Exit

Luckily, this candle is relatively big and goes way beyond the minimum target. A perfect opportunity to exit.

As you see, the shooting star candle pattern gives us an indication that the trend might reverse. This creates a nice premise to short HP right in the beginning of an emerging bearish trend. Despite the small correction on the way down, the shooting star reaches the target of three times the size of the candlestick.

Example #2

Let’s now try this strategy one more time on another shooting star trading example:

 trading strategy 2
shooting star trading strategy 2

We now have the 1-minute chart of Apple from December 22, 2015.

The chart starts with a price increase – Apple creates higher highs and higher lows. On the way up, the price action forms a shooting star candlestick pattern on the chart (the green circle on the image).

Now we have a reason to believe that the price action could be reversed. We wait to see if the next candle is going to confirm the authenticity of the shooting star reversal pattern.

Entry

Fortunately, the next candle is bearish and breaks the low of our shooting star candle on the chart. This gives us a strong bearish signal and we short Apple at the end of the bearish candle. At the same time, we place a stop loss order at the highest point of the shooting star – above the upper candlewick.

Now, the trade is protected against rapid price moves contrary to our trade.

Raining Profits

The blue arrows on the image measure and apply three times the size of the shooting star candle pattern.  After we short Apple, the price enters a downtrend.

After the first bearish impulse on the chart, the price creates a range between $107.30 and $107.40 per share. The range is then broken and the price action creates a new bearish impulse on the chart.

This impulse leads the price to complete a total bearish move of three times the size of the shooting star pattern. This is the minimum target for our trade and we close the position.

Another successful trade in the books.

Recap

  • The shooting star falls into the “Hammer” candle family.
  • There are three basic tricks for trading the shooting star candlestick figure:
    • Sell the security after the creation of a bullish trend, a shooting star candle, and a bearish confirmation candle.
    • Put a stop loss right above the upper candlewick of the shooting star figure.
    • Stay in the short trade for a bearish price move equal to at least three times the size of the shooting star candle including the upper and the lower candlewick.
  • This shooting star trading strategy contains around 3:1 Win-Loss ratio.

How to Practice This Strategy

If you find yourself overwhelmed or new to candlestick patterns, the best way to get a firm grasp of the strategies is through deliberate practice.

There is no more efficient way of doing that than in a trading simulator with a realistic trading environment.

To that end, we’ve put together a handful of reference guides for the best bullish and bearish candlestick patterns to help guide you along the way. So, be sure to check those out and download our cheat sheets.

Stars, Dojis and Abaondoned Baby

Candlestick patterns can have some crazy names sometimes. Stars, dojis, and abandoned babies? The Japanese were fond of naming candlestick patterns after real-life visual representations. Shooting stars, morning stars, evening stars and abandoned babies are all examples of indecision reversal candle patterns. We’ll introduce you to them in this post.

If you haven’t checked out our complete explanation of candlestick patterns, be sure to do so. In it, we cover the construction of a candlestick chart, the history of candlesticks, and common candlestick reversal patterns. It also has a link to a free cheat sheet that includes the stars, dojis, and baby patterns.

What are Candlestick Stars?

As noted above, stars are a type of indecision candle. Typically we want to trade them as a powerful reversal pattern. But as with all candlestick patterns, context is everything.

Types of Candlestick Stars

The key rule to a star is that its real body does not overlap the previous candles real body. There are several variations of the star pattern:

  • morning star
  • evening star
  • doji star
  • shooting star

The Body

Stars will typically have a small body. This is particularly important for psychological reasons which we’ll get into in a moment. But for now, suffice it to say that stars usually open and close very tightly.

The small body of a star candle

Of course, these candles can appear anywhere on a chart. With the examples below, we’ll teach you the proper context where they should appear for profitable reversal patterns.

Exhaustion Gaps

Candlestick stars gap

On a daily chart, the Candlestick Stars will typically appear with a gap at the highs of an extended run, or the lows of an extended sell off. This is the key to the reversal patterns

Candlestick Stars will typically be associated with increased volume at these climactic ends as well. This also is part of the psychology of the pattern.

Psychology of the Candlestick Star Pattern

As a star has a small real body, it represents indecision by bulls and bears.

How so?

Think about it this way:

When a stock is trending upward aggressively, strong hands and institutions will be selling into that strength. Meanwhile, retail traders may be buying here unaware that the stock is about to turn.

Likewise, because the stock is so extended, short sellers will be initiating their positions as well, adding more supply to the stock.

As all of this occurs at once, we get a star candle that can’t seem to make up its mind on moving higher or lower. A lot of activity, but not much movement in either direction. That is, until the next candle.

While the primary trend is still intact, the presence of the star is the first sign that the trend could turn. Think of it like a crossroads.

It is the second candle that will tell us whether the reversal pattern is confirmed or not.

Candlestick Star Variations

Morning Star

Morning Star

The morning star candle is a bottom reversal signal that comes after an extended downtrend.

This pattern is a three candle reversal setup. The first two bars are the typical star setup discussed above. The major difference with this pattern is the third candle in the formation.

It is a very strong green candle, which does not have to be a gap and closes at least halfway into the first candle.

Assessing the Strength of the Morning Star Signal

The further the green reversal candle closes into the first bar (the red bar preceding the star), the more bullish the formation.

On that note, outside of the morning star candlestick pattern revealing itself, look for other indications that this pattern is confirming. For example, you want to see high volume in the third candle, indicating strength.

Additionally, the morning star works very well when it occurs at previous support levels. The more criteria you can find, the better.

On the other side of the coin, if you buy a stock that prints the morning star, be prepared for some sort of pullback.

It is not uncommon for that to happen nearly 50% of the time. If there is a violation of the lows, then the morning star is failed.

Let’s take a look at the morning star candlestick at work with a live trading example.

Morning Star Trading Example

VLO Morning Star trading example
VLO Morning Star

This is a beautiful morning star setup.

First of all, the morning star came in at previous support near the 60.37 level. The star candle came in the form of a hammer.

Refer back to our Candlestick Guide to learn more about the hammer.

There was high volume that came along with the hammer, and this was an even bigger sign that this level would hold as support. The following day, the stock accelerated with a gap higher and closed well into the top half of the first bar.

As mentioned earlier, the presence of this pattern does not indicate an immediate rally. As you can see, the gap created from the second to the third bar was backfilled.

Smaller gaps, such as this one, tend to fill in the short term. Even if one had waited for the high of the third candle in morning star to be broken above, five points could have been made in that short amount of time.

Evening Star

The evening star candlestick is the bearish version of the morning star.

Evening star formation
Bearish Star Candle

It is a top reversal pattern that occurs after a sustained uptrend. The evening star is also a three candle pattern.

Evening Star Formation

The first candle is a strong bullish candle. The second candle is the star, and the third is a red body that closes well into the first candle.

Again, as with the bullish morning star, the third candle in the evening star does not have to be a gap.

Here are a couple of factors that increase the chances of this pattern succeeding:

  1. The real bodies of all three candles do not overlap
  2. The third candle closes well into the first one; preferably regaining 75% of the candle
  3. Volume should lighten up on the first candle and increase on the third.

Just as the lows of the morning star pattern provide support, the highs of the evening star candle formation serve as resistance to any further upside movement.

Doji Stars

A candlestick doji pattern is a candle that lacks a real body. This means the open and close of the bar are essentially the same. It has a strong significance after substantial advances or declines.

The lack of direction is a potent reversal signal, especially if it is followed by a candle in the anticipated direction, and at the end of a trend.

When a doji is the star within the morning star and evening star candlestick patterns, the formations are known as the morning doji star and evening doji stars.

doji star
Doji Star

Notice, the Evening Doji star image above is an abandoned baby top, while the morning doji star is not. We’ll explain why below.

Abandoned Baby Candle

Another extremely powerful version of the doji star is the abandon baby top or abandon baby bottom. This pattern is the equivalent to what some know as the island reversal.

Abandoned Baby Patterns

The abandoned baby candlestick has a doji as the second candle with a gap on both sides.

If you think about the psychology of this setup, the first gap came in an exhaustive fashion.

The stock was already in a strong uptrend or downtrend, and then it made a gap which closed near its open. This was the first sign that the directional pressure was fading.

Now, with the third candle gapping in the opposite direction of the trend, we have confirmation that a more significant trend reversal has taken place.

The Shooting Star

Shooting Star Candlestick Pattern
Shooting Star

The final star variation we will discuss is the shooting star, which occurs after a strong uptrend (or the inverted hammer that occurs after a strong move down).

The shooting star has a long upper shadow with a small real body at the lower end of the candle. This pattern usually presents itself as a sign of a short term correction rather than a more potent reversal signal.

Along those lines, it is telling us that the market’s rally could not be sustained. The market opened at or near its lows, shot up much higher and then reversed to close near the open.

The Body

Ideally, the real body of the shooting star should gap away from the previous candles’ real body. While it is not necessary, it adds confirmation to the validity of the impending reversal.

Why? Again, it all has to do with exhaustion in either direction.

Additionally, take a look at the previous candles; many times you will see overhead shadows on those candles as well. This indicates that the stock is struggling to go higher; just another clue as to what might happen.

When a shooting star forms near a resistance level, a very powerful resistance level is created.

As mentioned before, the shooting star is a short term topping formation, and any break above the high of this candle is a failed confirmation.

Variations

Shooting Star and Gravestone Doji

There is one variation to the shooting star you should consider; it is known as the gravestone doji. The gravestone doji is a shooting star with virtually no real body, the open and close are exactly the same.

This formation is more powerful than the typical shooting star and portends a more serious reversal.

Summary

Candlestick patterns are a great way to assess the trend of a stock. The key to its secret is the fact that candlesticks are a visual representation of price action.

These reversal candles can help the astute trader anticipate a trend change or continuation. Just remember, you need other validation points. These can come in the form of a technical indicator or other chart patterns.

How Can Tradingsim Help?

You can use Tradingsim to scan the markets and locate these candle reversal patterns. You can then apply your own trading strategy to find the optimum setups for profits.

Work on developing your own specific rules for entries, stops, and targets.

As always, be sure to ask yourself the following questions when practicing any setup:

  • what qualities work for each particular setup
  • what criteria were met, or not met
  • how was volume associated with the pattern
  • where could you have set your risk and profit target
  • how many of your trades worked or didn’t work
Bearish reversal candlestick patterns

Recently, we discussed the general history of candlesticks and their patterns in a prior post. We also have a great tutorial on the most reliable bullish patterns. But for today, we’re going to dig deeper, and more practical, explaining 8 bearish candlestick patterns every day trader should know.

We’ll cover the following:

  • What these patterns look like
  • The criteria for confirming them
  • The story these candles tell
  • How to set entries and risk for each
  • Some common mistakes when interpreting them.

Also, feel free to use our quick reference guide below for bearish candlestick patterns! Be sure to save the image for your use with your trading and training in the market!

What Bearish Candlesticks Tell Us

Hopefully at this point in your trading career you’ve come to know that candlesticks are important. Not only do they provide a visual representation of price on a chart, but they tell a story.

Behind this story is the belief that the chart tells us everything we need to know: the what being more important than the why. Each candlestick is a representation of buyers and sellers and their emotions, regardless of the underlying “value” of the stock.

Bearish candlestick patterns typically tell us an exhaustion story — where bulls are giving up and bears are taking over. Many of these are reversal patterns.

Check out or cheat sheet below and feel free to use it for your training!

Bearish Candlestick pattern cheat sheet

Without further ado, let’s dive into the 8 bearish candlestick patterns you need to know for day trading!

1. The Shooting Star

Shooting star

In case you were wondering, the names of candlestick patterns usually describe a visual representation to something in real life. The Japanese were fond of naming them that way.

The shooting star is no exception.

When it occurs, it will be at the height of a current uptrend — typically an extended trend.

It’s a lot like a shooting star falling from the heights of the heavens.

At the end of that trend, the stock experiences one last effort to push higher, only to reverse on itself. Hence the name, shooting star.

It goes up, only to fall back.

Entry

Where would you enter?

More aggressive traders may anticipate the reversal as the candle is forming. Otherwise, you can wait until the close of the shooting star, enter, and set your stop at the high of the shooting star candle.

Shooting Star Example

AMC provides a great example of this pattern during a recent intraday session. Notice that the trend was clearly upward and becoming extended. The stock makes a climactic push to new highs, then reverses on increased volume.

AMC bearish candlestick pattern shooting star
AMC with a fantastic example of a Shooting Star

Also, notice that the second reversal candle beyond the shooting star. It retraces slightly into the wick of the shooting star. This is a great example of why your stops/risk need not be too close, or wait for entry on the second candle.

For a more granular look at this pattern, check out our post on how to trade using the Shooting Star.

2. Bearish Engulfing Crack

Bearish Engulfing Candlestick Pattern

This reversal pattern can be seen in different contexts. It can occur off the open, or in an extended uptrend.

The thesis behind the pattern points to strong supply levels that completely surpass the effort of bulls to push a stock upwards. The result: the price opens above the preceding candle, then commences to sell off forcefully.

The body of the candle completely “engulfs” the prior candle, and should close below it.

Entry

There can be a few discretionary entries on this pattern depending on experience. Aggressive traders may choose to enter as the candle is forming, if supply is clearly visible. This is more of an anticipatory entry.

If trading “by the book”, you may want to wait until the new low is confirmed, then enter on the next candle.

Ideally, you want to trade in either the direction of the larger trend, or enter as an overextended trend reversal.

Set your stop in the body of the candle or at the high of the candle depending on its range.

Bearish Engulfing Examples

FCEL is a perfect example of this bearish candlestick pattern on the 5-min chart. Notice that the stock is trending downward from the pre-market. It is also struggling with VWAP, the red indicator line on the chart below.

Bearish engulfing candlestick pattern example
FCEL with an opening range breakdown and Bearish Engulfing Crack

Off the open, the stock tries to push higher, but we notice some selling pressure in the upper wick of that first green 5-minute candle. The price then moves lower, engulfing that candle with ease of movement to the downside.

This just happens to be a great example of an Opening Range Breakdown as well.

BA provides us with another look at this bearish candlestick pattern in a different context.

Bearish Engulfing Candlestick Pattern example 2
BA with an overextended bearish engulfing candle

Notice the reversal from an extended intraday run here. Just like the example above, the 5-minute candle completely engulfs the prior candle. This time, it is with increasing volume.

What does that tells us?

Think in terms of effort vs. result. The effort (volume) increased and the result (price) was a complete retracement downward (link to effort/result).

This gives us the confidence to go short, risking toward the highs.

3. Bullish Engulfing Sandwich

Bullish Engulfing Sandwich Candlestick Pattern

Do not be confused by the name. This is also called a “stick sandwich”. It is not a bullish pattern in this particular scenario.

The point here is that the “bullish” engulfing candle in the middle of the pattern is “sandwiched” by bearish candles.

In this instance, it takes more than a single supply candle to overcome the demand. It takes three or four candles for the pattern to confirm.

First, you have what appears to be a bullish engulfing candle (the opposite of the bearish engulfing candle we just identified above). Then, instead of confirming new highs, the stock reverses again.

Context is everything here. In the example below, you’ll see that the general trend is downward. For this reason, the bullish engulfing sandwich can be thought of as a continuation pattern.

Entry

Entry is on confirmation of a breakdown — lower lows on the reversal candle. Stops can be set in the body of the candles above.

Bullish Engulfing Sandwich Example

FUBO provides a fantastic opportunity to see this bearish candlestick pattern in action right at the opening of the market.

Bullish Engulfing Sandwich pattern, also known as a Stick Sandwich
FUBO intraday Bullish Engulfing Sandwich pattern

Notice that the trend is downward from the premarket. It was also continuing downward from the day before.

The stock stalls at vwap, struggling. It tries to reverse, but notice the volume on the green reversal candle. It is no match for the supply in the first 5-minute candle of the day.

The effort in that first candle dwarfs the efforts of the bulls.

The stock then reclaims vwap, its downward trajectory, and the bulls submit to the bears one more time.

Learn more about this bearish pattern and it’s bullish counterpart in our blog post covering the Stick Sandwich.

4. The Evening Star

Evening Doji Star and Evening Star bearish candlestick patterns

We’ve included the Evening Star with the Evening Doji Star because they are very similar, both in style and in context.

Each are bearish candlestick patterns.

Leading into the star, you’ll need to spot a wide bodied candle. The star itself is the narrow body indecision candle that follows the upward wide-body candle.

Entry

The confirmation comes with the breakdown on the longer bodied bearish candle. A great place to enter, risking off the highs of the doji candle.

This pattern works particular well at the high of the day as a trend reversal. But it can also be a trend continuation pattern if it appears at the top of a short-lived rally into prior resistance.

Evening Star Example

In this intraday example with GME, we notice that the upward trend has been strong. For the first hour+ of the morning, there have been few, if any pullbacks.

GME Evening Star bearish candlestick pattern
GME with an evening star pattern playing out intraday

However, we notice some selling pressure coming on this 5-minute chart just before 10:30am. Typically we might have played that as a shooting star, but we never got the breakdown confirmation with a close below the body of that candle.

Despite the failed breakdown on the shooting star, it is a warning sign that supply is coming into the market.

The alert trader keeping his/her eyes open for any signs of reversal on this overextended stock would notice the Evening Star forming on increasing volume. Again, the effort (volume) is there, but the result (price) is a small doji candle.

How can we interpret this?

It is likely that there is plenty of profit taking going into this GME Evening Star candle as FOMO (fear of missing out) retail buyers chase the stock higher. Strong hands are taking the opportunity to sell their shares.

FOMO Meter

This gives the attentive trader an opportunity to capitalize by going short.

5. Tweezer Top

Tweezer Top bearish candlestick pattern

The tweezer top is yet another reversal pattern or continuation pattern.

The 1st element is the wide body bullish candle signaling potential exhaustion in an uptrend. This is followed by weak or no effort to continue higher, hence the reversal.

Ideally, volume is increasing during both of these candles as supply is added to the market as weak hands are tempted to continue buying here.

As a bearish pattern, the two candles should share roughtly the same high if possible.

Entry

Entry can be made on a close below the reversal candle with a stop set at the high.

Tweezer Top Example

Take a look at this AMC tweezer top. Can you see the green and red candles providing the proper representation of the two sides of a pair of tweezers?

Tweezer Top AMC example
AMC putting in a tweezer top pattern intraday

Depending on the range of the candles, you can enter aggressively as the tweezer is forming, especially if supply appears heavy.

Otherwise, you can wait until the candle closes for your entry and set a stop at the high of day, or in the body of the tweezer top. This is discretionary depending on the risk/reward you are looking for, as well as your risk personality and position size.

As you can see from the chart, often times vwap can be a great target area (red line).

6. Dark Cloud Cover

Dark Cloud Cover bearish reversal pattern

Dark Cloud Cover is the opposite of a bullish reversal pattern called Piercing Line. For the bearish pattern, it must first have a solid green or white bar continuing the uptrend.

After the bullish candle closes, we expect to see another candle try to make new highs. This new candle fails, then closes more than midway into the body of the 1st candle. Hence, the overhead supply is called “dark cloud cover.”

One of the best ways to play this pattern is in an overall downtrend during a short term reversal. As the stock tries to rally into resistance, you can anticipate the end of the rally.

Entry

Positions should be entered as the stock breaks the prior bar with stops set at the high of the candle.

Dark Cloud Cover Example

Occasionally the market gifts us with a nice double top failure in an overall downtrend. RIOT gave us this opportunity intraday recently as it pulled back from the morning lows, only to find resistance at vwap.

Dark Cloud Cover bearish candlestick pattern example
RIOT forming a double top with bearish Dark Cloud Cover candlestick pattern

As you can see, RIOT was struggling to overcome vwap on heavy volume the first try. The second try gave us a beautiful confirmation with the Dark Cloud Cover pattern.

7. Shrinking Candles

Shrinking Candles

Shrinking candles are a classic example of effort vs result. It is a bearish reversal candlestick pattern usually accompanied by a huge volume signature below.

The understanding is that the amount of effort to push the stock to new highs is increasing. However, the result is decreasing.

How do we interpret this?

Given the context, it should imply that a considerable amount of selling pressure is adding to the volume as price moves sluggishly upward. This selling pressure is counteracting the demand.

Why else would the candles be shrinking?

Once bulls realize this, it is often too late. Without proper buying underneath, the result can be devastating for long chasers wrongly assuming there is upward momentum.

In essence, there is no synchronicity between volume and price. They are at odds with each other on the way up. An anomaly, if you will.

Shrinking Candles Example

Here is real example from the 5-minute chart of BTBT. As you study this chart, pay close attention to the volume and how it corresponds with each candle.

Shrinking Candles pattern example
BTBT displaying a Shrinking Candles pattern intraday

As you can see, the largest amount of volume comes as BTBT tries to rally above the pre-market highs. As it does, the candles begin to shrink.

Momentum is being lost as gravity, supply in this case, strangles this rocket off the morning lows. Strong hands take advantage of morning break out buyers, who are left holding the bags as the stock fades the rest of the day.

Entry

As you look at the chart, hopefully you can pinpoint a great short entry as the last green candle is broken to the downside. The double top is clear, and a close risk/stop can be set at the highs.

8. Hanging Man

Hanging Man candlestick pattern

Hanging Man is very similar visually to the Hammer pattern. The Hammer is usually bullish at the end of a down trend. However, the Hanging Man is a bearish candlestick pattern at the end of an uptrend.

Selling pressure is the key to recognizing this pattern.

Inside the formation of the candle, there is considerable selling pressure to begin with.

The close at the highs can be misleading in that the selling pressure is mostly overcome as it rallies.

Often times this results in an opportunity to trap longs who may believe the supply was overcome by demand.

However, the supply is still present.

If longs who bought on the way back up are overcome on the next candle, they are likely trapped from their entries and will add to the selling pressure as the stock capitulates.

Hanging Man Example

Check this beautiful uptrend on the recent intraday chart of PLUG. It appears there is nothing to stop the upward momentum. That is, until we get the Hanging Man, signaling the top for us.

Hanging Man bearish reversal pattern
PLUG 5-minute chart displaying a Hanging Man reversal pattern

Entry

Ideally the next candle after the close of the Hanging Man would provide the nearest risk/reward entry at the top.

If you aren’t fast enough to enter on the close of the Hanging Man and risk to the highs, it does offer a right shoulder for entry later.

How To Practice Candlestick Patterns

So there we have 8 of the most common bearish candlestick patterns. Now you’re probably wondering how to spot them in real time.

We do have a handful of quick reference guides. These can be a great resource in the moment if you are unsure.

However, learning the context of these patterns is paramount. Otherwise, you may find yourself trading them without proper confirmation. It takes time and experience.

How do you speed up the learning curve?

There is no better way to rapidly increase your exposure to these patterns than in a simulator.

Imagine being able to replay the market for any particular day up to three years in the past. You can do it in your spare time.

Pick a day, pick a pattern, pull up the scanner, and take notes every time you see the pattern play out well.

As you practice, ask yourself these questions:

  • Where did the pattern occur in a trend?
  • Did the pattern confirm?
  • How was volume associated with the confirmation of the pattern?
  • Would the risk/reward have been worth it for the trade?

Conclusion

We hope you’ll find this lesson a beneficial tool in your short-trading-strategy belt. Nothing beats the ability to read charts well and bearish candlestick patterns are an integral part to that process.

Candlestick Pattern Quick Reference Guide

Trading without candlestick patterns is a lot like flying in the night with no visibility. Sure, it is doable, but it requires special training and expertise. To that end, we’ll be covering the fundamentals of candlestick charting in this tutorial. More importantly, we will discuss their significance and reveal 5 real examples of reliable candlestick patterns. Along the way, we’ll offer tips for how to practice this time-honored method of price analysis.

Also, feel free to download our Candlestick Pattern Quick Reference Guide!

Why Do Candlestick Patterns Matter?

After all, there are traders who trade simply with squiggly lines on a chart. Astonishingly, some don’t even look at the charts! Instead, they pay attention to the “tape” — the bids and offers flashing across their Level II trading montage like numbers in The Matrix.

Level II montage gif
A Level II montage. Source: CenterPoint Securities

No doubt, there are countless ways to make money in the stock market. In fact, there is no right or wrong way to read a chart. But unless you are just a gambler, you need some form of data to make informed decisions.

We believe the best way to do this is by understanding candlestick patterns.

For newer traders, even reading candlestick charts can seem like an insurmountable learning curve. There appears no rhyme or reason, and no end to the amount of price and volume data being thrown your way.

It’s daunting, for sure. Especially when you’re just getting started.

But be of good cheer! There is a method to the madness. The method is in the patterns. The patterns reveal probabilities. And the right probabilities create opportunities.

More importantly, the right opportunities can create profits.

This is where candlestick patterns come in handy. They help us to decipher the patterns of the market. They’re like little road signs on crowded streets. And with enough repetition, enough practice, you just might find yourself a decent chart reader.

That’s why you’re here, right? To learn to navigate the murky waters of the market?

Trust us, it is a worthwhile endeavor.

Who Discovered the Idea of Candlestick Patterns?

According to Investopedia.com, it is commonly believed that candlestick charts were invented by a Japanese rice futures trader from the 18th century. His name was Munehisa Honma.[efn_note]Farley, A. (2021, April 29). The 5 Most Powerful Candlestick Patterns. Investopedia.Com. https://www.investopedia.com/articles/active-trading/092315/5-most-powerful-candlestick-patterns.asp.[/efn_note]

Honma traded on the Dojima Rice Exchange of Osaka, considered to be the first formal futures exchange in history.[efn_note]NinjaTrader. (2019, April 17). Candlestick Charting: Legend of Munehisa Homma. NinjaTrader.Com. https://ninjatrader.com/blog/candlestick-charting-legend-of-munehisa-homma/.[/efn_note]

As the father of candlestick charting, Honma recognized the impact of human emotion on markets. Thus, he devised a system of charting that gave him an edge in understanding the ebb and flow of these emotions and their effect on rice future prices.

Honma actually wrote a trading psychology book around 1755 claiming that emotions impacted rice prices considerably.[efn_note]Beyond Candlesticks: New Japanese Charting Techniques Revealed, Steve Nison , Wiley Finance, 1994, ISBN 0-471-00720-X.[/efn_note]

When all are bearish, there is cause for prices to rise.

Munehisa Honma[efn_note]Beyond Candlesticks: New Japanese Charting Techniques Revealed, Steve Nison , Wiley Finance, 1994, ISBN 0-471-00720-X, p14.[/efn_note]

In recent history, Steve Nison is widely considered the foremost expert on Japanese candlestick methods. After all, he wrote the book that catapulted candlestick charting to the forefront of modern market trading systems.

Beyond Candlesticks: New Japanese Charting Techniques Revealed, is one of his most popular books and a definitive resource for candle patterns.

Since the 90s, this method of charting has become pervasive throughout all financial markets: equities, futures, forex, and more.

In his books, Nison describes the depth of information found in a single candle, not to mention a string of candles that form patterns. It truly puts the edge in favor of a skilled chartist.

The Story That Candlesticks Tell

Candlesticks are telling us a story. The story is a reflection of what buyers and sellers are doing.

Emotions and psychology were paramount to trading in the 1700s, just as they are today. This is the foundation of why candlesticks are significant to chart readers.

How so?

Every candle reveals a battle of emotions between buyers and sellers.

As the great trading psychologist Brett Steenbarger notes, “proper training is the best source of discipline and the most effective safeguard against intrusive anxiety and impulsivity.”

With this in mind, understanding the emotional story within candlesticks is a great place to start that training.

How are Candlesticks Formed?

There are three types of candlestick interpretations: bullish, bearish, and indecisive. This is painting a broad stroke, because the context of the candle formation is what really matters. But for all intents and purposes, we’ll stick with these three categories.

The elements of a candlestick graph
The elements of a candlestick

What Is a Candlestick?

The formation of the candle is essentially a plot of price over a period of time. For this reason, a one minute candle is a plot of the price fluctuation during a single minute of the trading day. The actual candle is just a visual record of that price action and all of the trading executions that occurred in one minute.

Similarly, a daily or weekly candle is the culmination of all the trading executions achieved during that day or that week.

The open tells us where the stock price opens at the beginning of the minute. The close reveals the last recorded price of that minute. The wicks (also known as shadows or tails) represent the highest and lowest recorded price from the open and close.

According to Nison, the Japanese placed much less emphasis on the highs and lows of individual candles. For them, as it is for modern technicians, the opening and closing prices were more relevant.[efn_note]Beyond Candlesticks: New Japanese Charting Techniques Revealed, Steve Nison , Wiley Finance, 1994.[/efn_note]

Essentially, the broader context of candles will paint the whole picture.

What Is a Bullish Candle?

A bullish candle is formed when the price at the closing of the candle is higher than the open. This can be on any time frame: from a 1-minute candle to a 1-month candle. It will all be the same.

A bullish candle explanation
A bullish candle opens low and closes high.

Typically these candles close with a green or white body color, though most charting platforms allow for customization these days.

What Is a Bearish Candle?

Conversely, a bearish candle is assumed when the closing price is lower than the opening price. In other words, the price dropped in the amount of time it took for the candle to form.

A bearish candle explanation
A bearish candle opens high and closes low.

By default, most platforms will show a red or black candle as bearish.

What Does the Candle Formation Tell Us?

This is the real question we need to ask ourselves. It isn’t enough to know that the candle opened and then closed lower, or vice-versa.

As renowned trader and best-selling author Dr. Alexander Elder explains, “The main advantage of a candlestick chart is its focus on the struggle between amateurs who control openings and professionals who control closings.”[efn_note]Elder, A. (2014). The New Trading for a Living: Psychology, Discipline, Trading Tools and Systems, Risk Control, Trade Management (Wiley Trading) (1st ed.). Wiley.[/efn_note]

Dr. Elder may be referring to daily candles, but his point is still important. The candle represents a struggle between buyers and sellers, bulls and bears, weak hands and strong hands.

Every trader wants to understand the price action and read it well to improve their trading. Studying candlestick patterns helps us understand the price action and where the stock is more likely to go the next minute or the next few minutes.

Armed with that knowledge, let’s dig in and see what picture those little candles are trying to paint for us.

The High of the Candle

The high of each candle, whether it is the tip of the wick at the top, or if the body closes at the top, represents the maximum effort of bulls. If it is a daily candle, buyers could not push the price of the stock one cent more during that day.

Why is that important? There are two reasons:

  1. This could represent a near term level of resistance which will have to be broken for the price to move higher.
  2. In order to find enough demand to push through that resistance, the stock may need to consolidate lower until enough shares are accumulated.
Inside a bullish candle pattern

The Low of the Candle

Just as the high represents the power of the bulls, the low represents the power of the bears. The lowest price in the candle is the limit of how strong the bears were during that session.

Why is this important? Again, two reasons:

  1. This could represent a near term level of support where bulls were able to stop the downward momentum
  2. To move lower, more supply may need to enter the market at higher prices.
Inside a bearish candle explanation

The Closing Price of Each Bar

This is where the story gets interesting.

When a candle closes above its opening price, we can assume that the bears won in some form or fashion. How much it closes above the open tells us with what intensity the bulls were in control during that session.

Let’s look at few examples to better understand this:

In this chart, we see the “Three White Soldiers,” which is a candlestick pattern describing three bullish candlesticks in a row. What can we interpret from this?

Three White Soldiers candlestick pattern

It is clear to see that the candles open low and close high. Bulls were clearly in control during each session with very little energy from the bears.

Now contrast that with what we see in the next example. Ask yourself, who was in control during this session?

Bullish Doji Candle explanation

Apparently there is indecision as to who is in control. How do we know? Think about the story behind this “Spinning Top” candle:

The stock opens, proceeds lower as bears are in control from the open, then rips higher during the session. But after putting in a decent high, the bulls settle back and give the bears some control into the close.

Are you beginning to see how the story unfolds?

These are the stories that candles tell us on charts. Who is in control (greed), who is weak (fear), to what extent they are in control, and what areas of support and resistance are forming.

The Range between the Open and Closing Price

This is one of the most important aspects of interpreting candles. As Dr. Elder notes, the range between open and close “reflects the intensity of conflict between bulls and bears.” [efn_note]Elder, A. (2014). The New Trading for a Living: Psychology, Discipline, Trading Tools and Systems, Risk Control, Trade Management (Wiley Trading) (1st ed.). Wiley. p 53.[/efn_note]

In day trading, momentum is everything. On this token, the character of the candles can tell us if there is demand or if a stock is sleepy and uninteresting — whether we are about to launch, fall off a cliff, or just grind sideways.

Additionally, the nature of the candles can tell us when to enter with tight risk. Or, when to take profits into climactic candles.

In the end, it all boils down to context and the story of buyers and sellers behind the tape.

5 Real Examples of Reliable Candle Patterns

Without practice, none of this information really matters. It takes screen time and review to interpret chart candles properly. There are no free lunches in the markets.

With that being said, let’s look at some examples of how candlestick patterns can help us anticipate reversals, continuations, and indecision in the market.

1. The Hammer / Hanging Man

The hanging man  occurs at tops and the hammer occurs at bottoms.

The Hanging Man is a candlestick that is most effective after an extended rally in stock prices. The story behind this candle tells us that there were extensive sellers in the formation of the candle, signified by the long wick.

It is usually accompanied by heavy volume.

The Hanging Man pattern
The Hanging Man appears at the top of an extended uptrend before reversing.

The Hammer is another reversal pattern that is identical to the The Hanging Man. The only difference is the context. The Hammer occurs at the end of a selloff, signifying demand or short covering, driving the price of the stock higher after a significant selloff.

Like the Hanging Man, you want to see a solid volume signature associated with these candles.

The Hammer pattern
Hammer candles appear at the bottom of a downtrend before a reversal

2. Engulfing Patterns

Engulfing patterns offer a great opportunity to go long while keeping risk defined to a minimum. As you can see in the example below, the prior bearish candle is completely “engulfed” by the demand on the next candle.

A bullish engulfing candlestick pattern
A bullish engulfing candle at the market open.

Another example of engulfing patterns is the Bearish Engulfing Sandwich. Here we have what appears to be a bearish reversal, but the next candle completely swallows the supply from that red candle:

A bearish engulfing sandwich, also know as a stick sandwich
A bearish engulfing sandwich pattern, also know as a stick sandwich

3. The Morning Star

The Morning Star is yet another reversal signal. It can be found at the end of an extended downtrend or during the open. It takes 3 candles to confirm the setup.

  1. The first candle must be a strong downtrending candle.
  2. The second candle is the star. It’s usually a narrow body candle that, ideally, does not touch the body of the prior candle.
  3. The third candle is a strong bullish candle confirming the new uptrend.
The morning star candlestick pattern explained at the open
The morning star candlestick pattern at the open

4. The Evening Star

Similar to the Morning Star, the Evening Star is its bearish cousin. It forms at the top of parabolic or extended bullish runs. Much like the Morning Star, the body of the candles should not touch.

Here are three criteria for spotting the shooting star:

  1. The bodies do not overlap
  2. The third candle is a strong bearish candle closing into the body of the first candle
  3. Volume should increase from left to right in the pattern
The Evening Star explained on GME
The Evening Star candlestick pattern on GME

As with all of these formations, the goal is to provide an entry point to go long or short with a definable risk. In the example above, the proper entry would be below the body of the shooting star, with a stop at the high.

5. Indecision Candles

The doji and spinning top candles are typically found in a sideways consolidation patterns where price and trend are still trying to be discovered.

Indecision candle patterns
Indecision candlestick patterns

The “doji’s pattern conveys a struggle between buyers and sellers that results in no net gain for either side,” as noted in this great article by IG.com.

Will it continue upward? Go sideways? Or reverse?

With indecision candles, we typically need much more context to answer these questions.

The Gravestone Doji is a perfect example of this:

The Gravestone Doji indecision candlestick explanation
Gravestone Doji candles can represent indecision on a chart.

Note the trend is mostly sideways in this first circled example. For this reason, waiting for the reaction to these candles is usually best for risk management.

Eventually, the price falls in this particular case as the trend becomes more extended into the rally. Correspondingly, the Shooting Star that occurs just beyond the Gravestone Doji is confirmation of that falling price action.

The Best Way to Practice with Candlestick Patterns

As always, it is best to practice a strategy before putting money to work in the market. There is no better way to do this than with a simulator.

One of the best methods to train your “chart eye” to see these patterns is to simply replay the market, noting each time you see a particular candle.

As you put in deliberate practice, ask yourself the following questions:

  • What candle formation is this?
  • What is the context? Uptrend? Down trend? Sideways?
  • Does this candle meet the criteria for a proper reversal?
  • Where could I enter with the least amount of risk?
  • What would confirm the pattern?

We have a wealth of knowledge on many different candlestick patterns, so be sure to check out those lessons, too!